 TRADING FOUNDRY
Capstone — Building Your First Simple Trading Plan.
Assemble everything in this course into a written, one-page beginner plan; follow it through three fully worked trades, including a loss; and know exactly what to practise next.
You now know what a pip is worth, what a trade costs, how leverage bites, when the market is awake, how to read candles, timeframes, trends and levels, which order to use, and how to size a position so that being wrong costs a fixed, small amount. Individually, those are pieces of knowledge. Put together and written down, they become a trading plan.
A plan is not a promise of profit. It is a set of decisions you make once, calmly, so that you do not have to make them again in the moment, when price is moving and your judgement is at its worst. It also makes your trading measurable: if you follow the same rules every time, your results tell you something about the rules. If you improvise, your results tell you nothing at all.
This capstone builds a deliberately simple beginner plan from the parts of this course, walks through three complete trades — two winners and a loser — and finishes with the one-page passport and the full pre-trade checklist. It is a training plan for learning on a demo account and then at the smallest live size. It is not a recommendation to trade anything in particular, and the example trades are illustrations, not real market history.
The eight parts of a plan
Every workable plan answers eight questions. Here are this course's answers.
- What do I trade, and when? One major pair — EUR/USD or GBP/USD — during the London morning (after the first 30–60 minutes) or the London–New York overlap. (Lessons 2 and 5.)
- Which timeframes? H4 for direction and levels; H1 for timing. (Lesson 7.)
- When is the market tradeable? Only when H4 shows a clear trend — higher highs and higher lows, or lower highs and lower lows. Ranges and unclear structure mean no trade. (Lesson 8.)
- Where do I look for entries? At an H4 support zone in an uptrend, or an H4 resistance zone in a downtrend, ideally one with role-reversal history. (Lesson 9.)
- What triggers the entry? A closed H1 rejection candle (pin bar) or engulfing candle out of the zone in the trend direction. Enter with a buy stop above its high, or a sell stop below its low. (Lessons 6 and 10.)
- Where is the stop? Beyond the zone and the signal candle's wick, plus a buffer of about the spread. (Lessons 9 and 10.)
- Where is the target, and how big is the trade? The next opposing swing or zone, and at least 2R away. Size so the stop costs 0.5–1% of the account. (Lesson 11.)
- What are my limits? One open trade at a time. Stop for the day after two losses. No entries within 30 minutes of high-impact news, or when the all-in cost is more than a fifth of the stop. Never move a stop further away. (Lessons 3, 4 and 11.)
The playbook, step by step
Here is the plan as a routine you can run every session.
- Calendar check. Note any high-impact releases for EUR, GBP or USD today. Mark the 30-minute no-entry windows.
- H4 structure. Label the trend: up, down or none. If none, close the charts — there is no trade today on this pair.
- H4 zones. Mark the nearest two or three support and resistance zones above and below price.
- Wait. Set alerts at the zones in the trend's direction. Do nothing until price arrives.
- H1 trigger. When price reaches a zone, wait for an H1 candle to close. Is it a rejection or engulfing candle pointing with the trend? If not, keep waiting — or let the zone go.
- Measure. Entry (2 pips beyond the candle's extreme), stop (beyond zone and wick plus buffer), target (next opposing level). Is the target at least 2R? Is the cost under a fifth of the stop? If either answer is no, there is no trade.
- Size. Calculate the position for 0.5–1% risk, round down, check backwards.
- Place all three orders together: entry stop order, stop-loss, take-profit.
- Leave it alone. No moving the stop away, no early exits on lower timeframe noise.
- Journal. Screenshot before and after, the reasons, the R result, and one line on whether you followed the plan.
Worked trade 1: EUR/USD long (winner)
Account £5,000, risk 1% = £50. GBP/USD at an illustrative 1.2700.
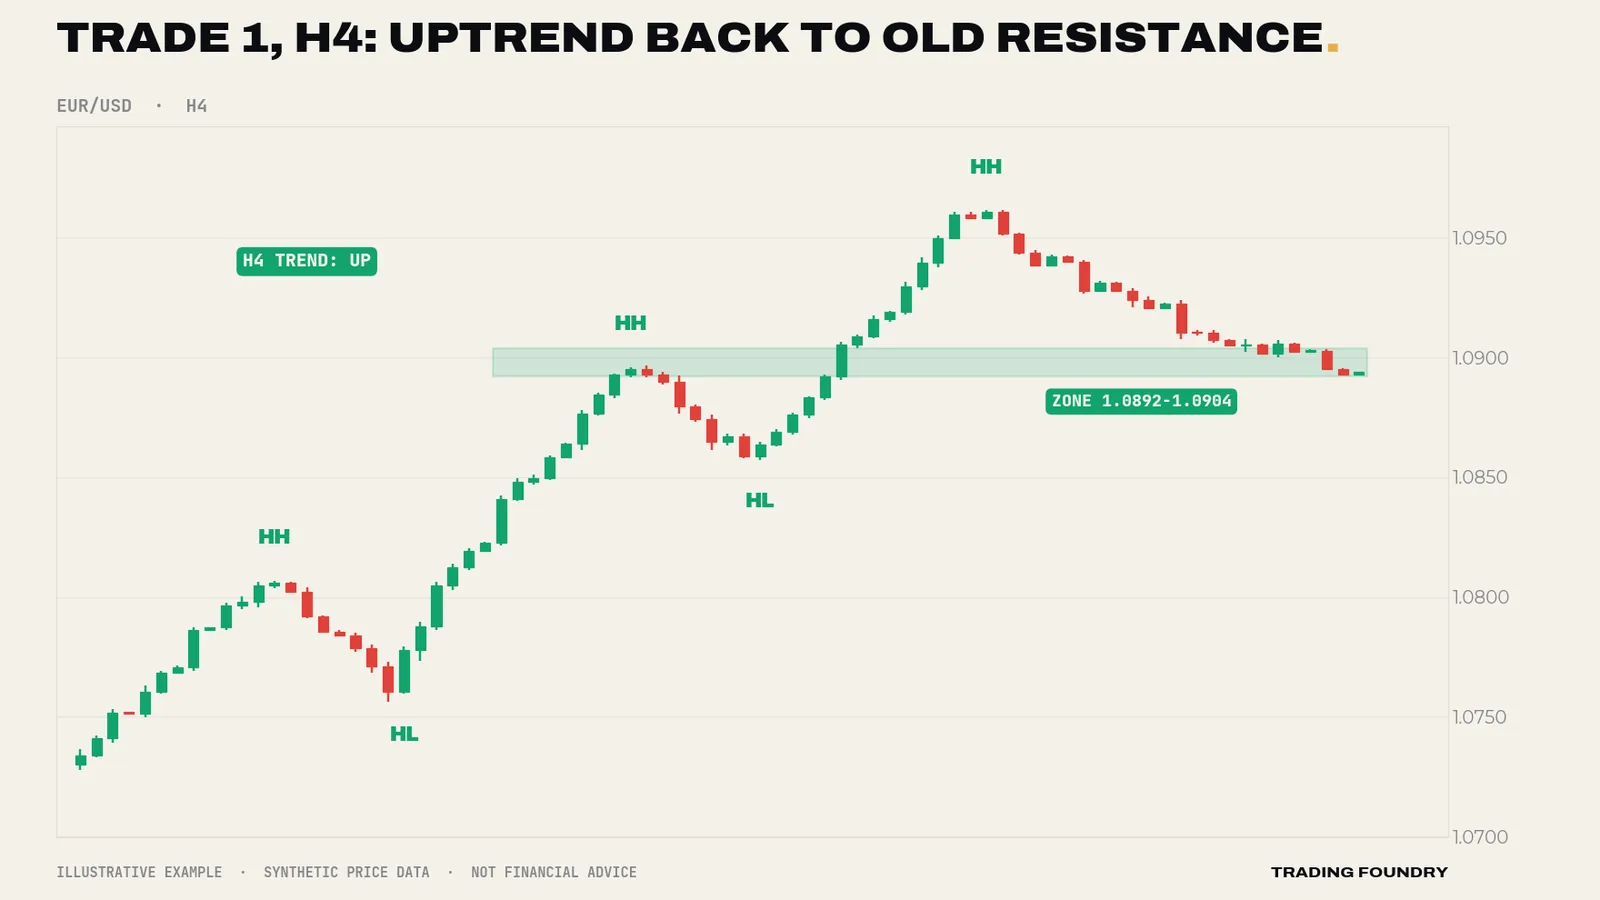
H4 context. EUR/USD has made a clear series of higher highs and higher lows. The last swing high, around 1.0900, was broken strongly and price has now pulled back towards it. That old ceiling is the zone to watch: 1.0892–1.0904.
H1 trigger. Price reaches the zone during the London morning. An H1 bullish pin bar forms with a low at 1.0891 and a high at 1.0910, closing near its high. No news is due for two hours.
Measurements.
- Entry: buy stop 2 pips above the high = 1.0912.
- Stop: below the zone and the wick with a buffer = 1.0889. Distance 23 pips.
- Next resistance: the prior high at about 1.0962. A 2R target is 46 pips → 1.0958, just below it. Target passes.
- Cost: about 1.2 pips, around 5% of the stop. Passes.
Size. £50 × 1.27 = $63.50. Size = $63.50 ÷ (23 × $10) = 0.276 → 0.27 lots. Check: 0.27 × $10 × 23 = $62.10 ≈ £48.90.
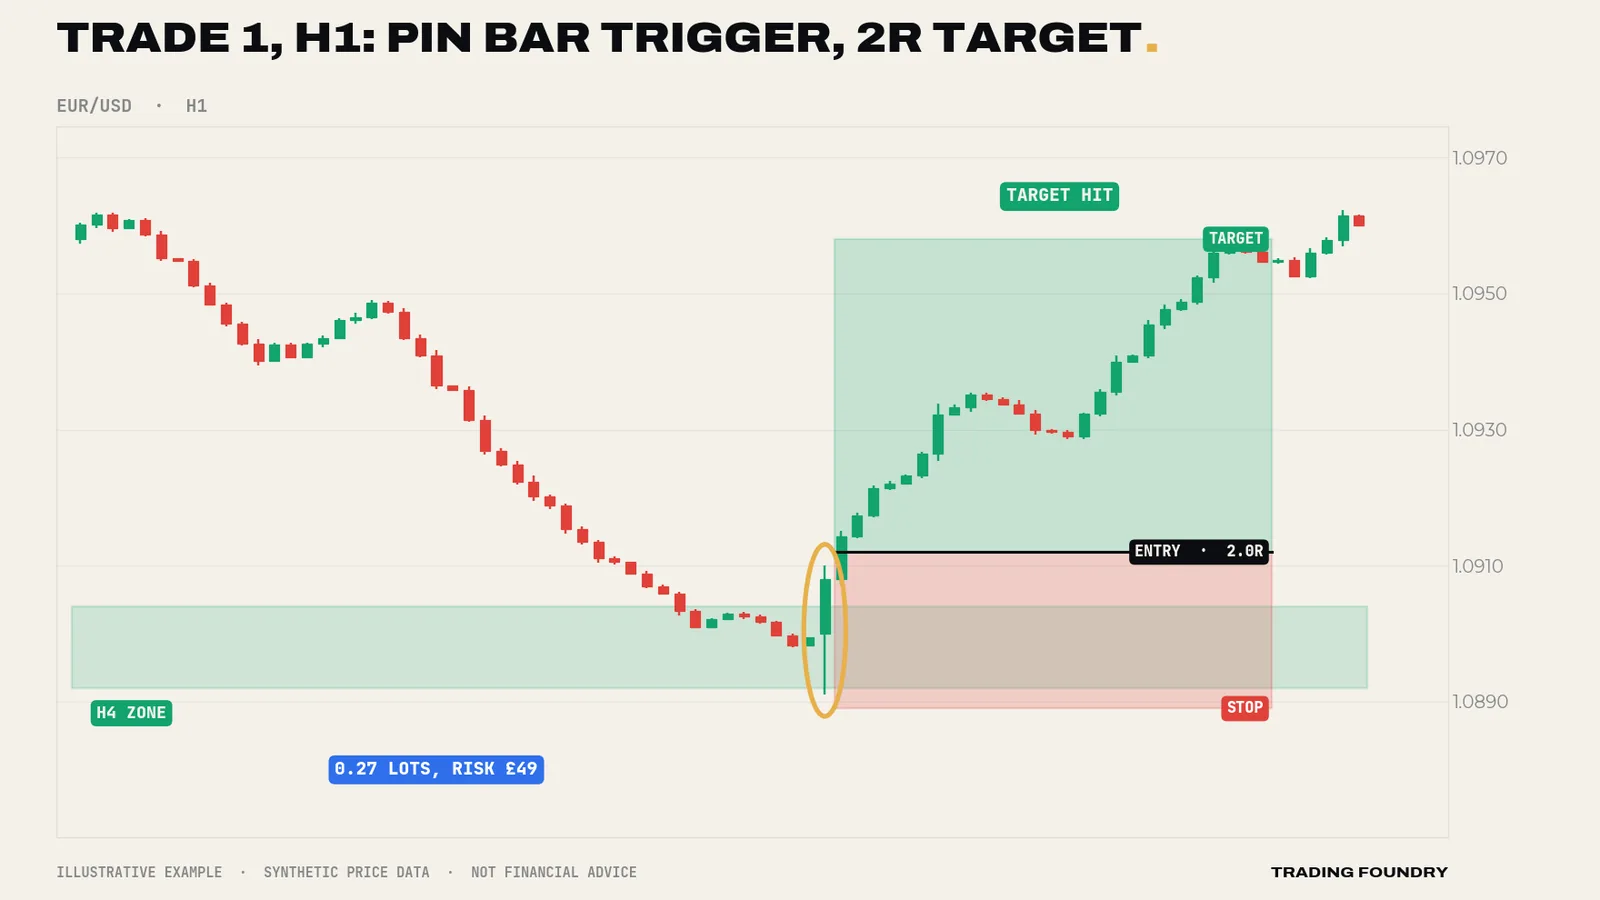
Result: +2R. The trader did nothing between entry and exit, which is the point.
Worked trade 2: GBP/USD short (winner)
Same account and risk. H4 GBP/USD is in a downtrend: lower highs and lower lows. Price rallies into a resistance zone at 1.2740–1.2752 that was support before the last breakdown.
H1 trigger. A small bullish candle pokes into the zone, then a bearish engulfing candle closes at 1.2732, low 1.2730, high 1.2755.
Measurements.
- Entry: sell stop 2 pips below the low = 1.2728.
- Stop: above the zone and the high with a buffer = 1.2758. Distance 30 pips.
- Next support: the prior low around 1.2660. A 2R target is 60 pips → 1.2668. Passes.
Size. $63.50 ÷ (30 × $10) = 0.212 → 0.21 lots. Check: 0.21 × $10 × 30 = $63.00 ≈ £49.61.
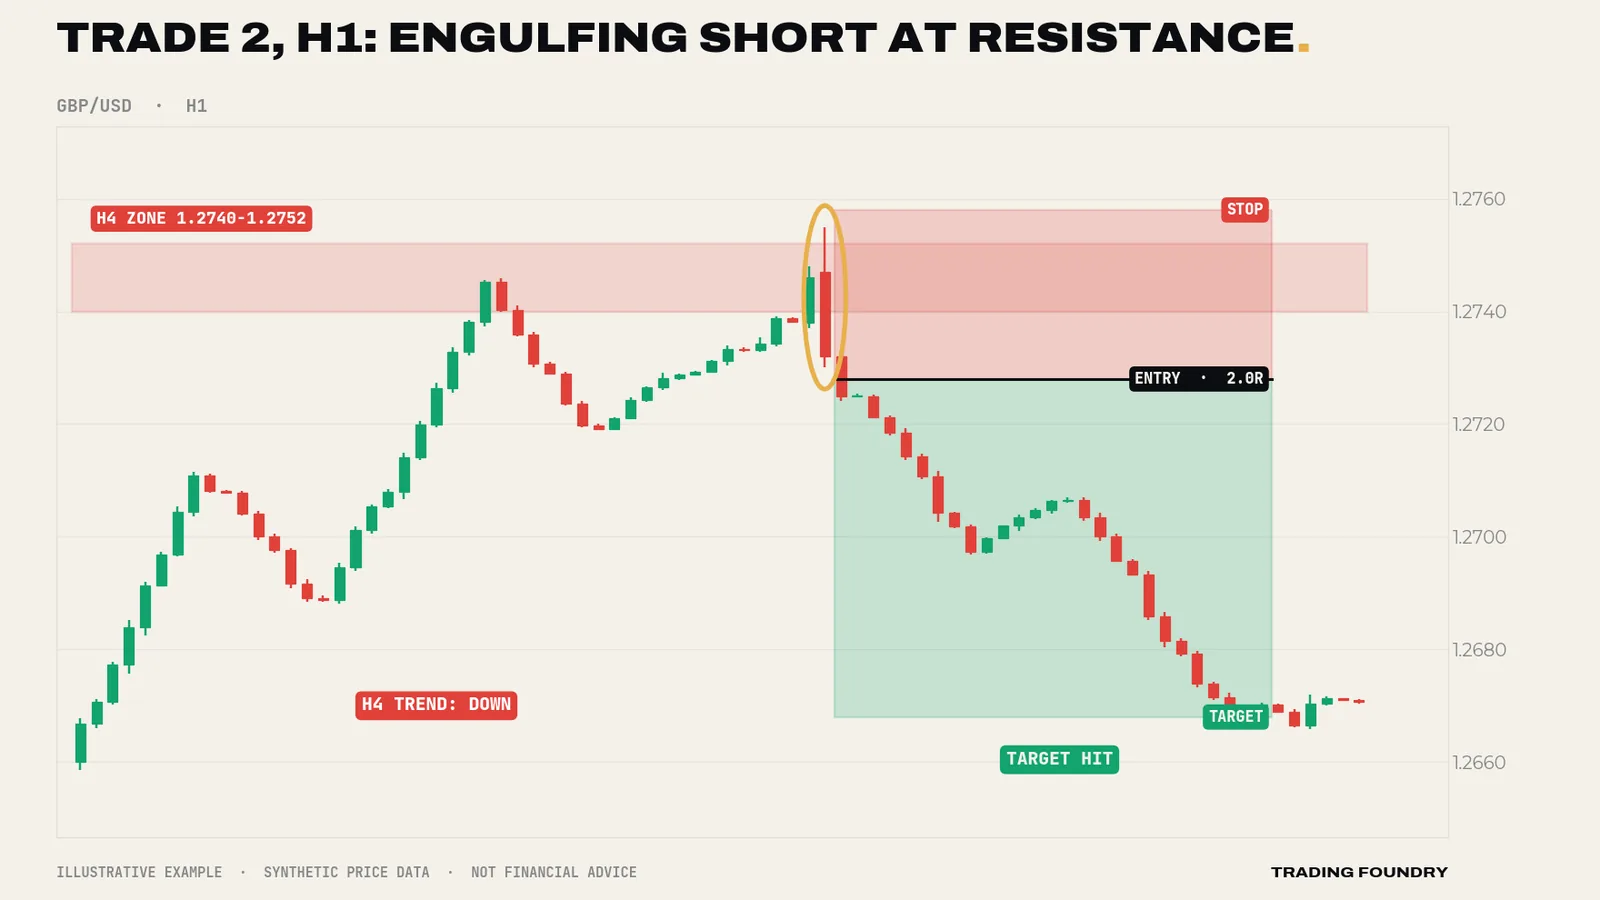
Result: +2R.
Worked trade 3: EUR/USD long (loser)
Same account and risk. H4 EUR/USD is in an uptrend and pulls back into a support zone at 1.0870–1.0882. Every box is ticked.
H1 trigger. A bullish pin bar: low 1.0871, high 1.0886, close 1.0884.
Measurements.
- Entry: buy stop 1.0888. Stop 1.0868, 20 pips. Target 2R = 1.0928, just below the prior high at about 1.0934.
- Size: $63.50 ÷ (20 × $10) = 0.3175 → 0.31 lots. Check: 0.31 × $10 × 20 = $62.00 ≈ £48.82.
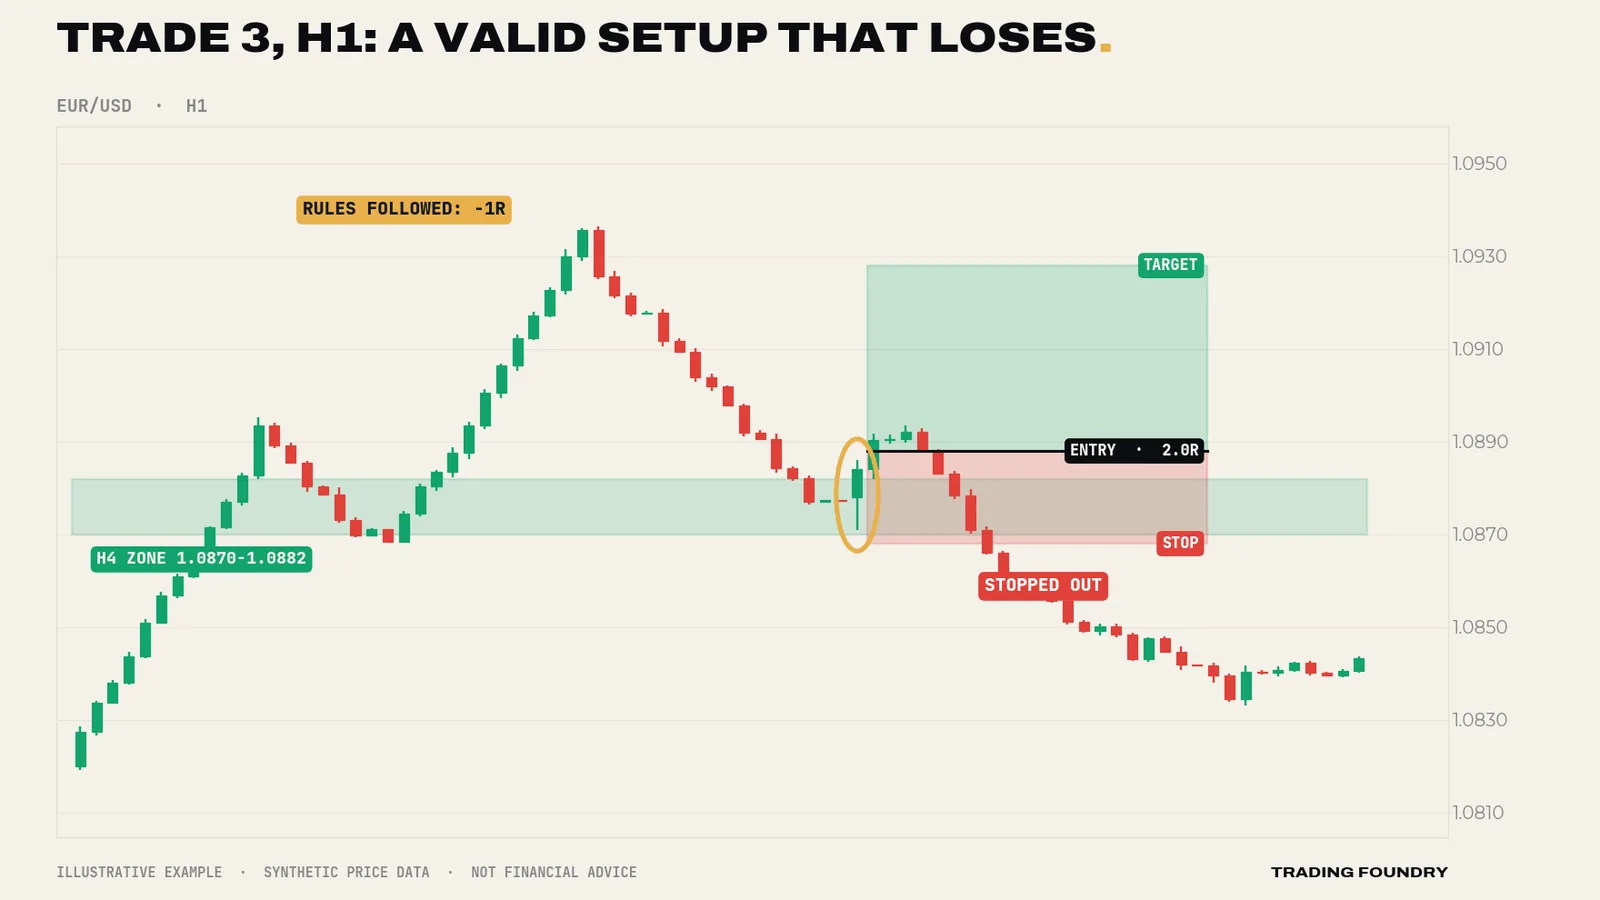
Result: −1R. Across the three trades: +2R + 2R − 1R = +3R, about £148 on a £5,000 account. Do not read anything into that number — three trades are far too few to tell you anything about a plan, and you could just as easily show three losers in a row. The point of the example is the process: three trades sized identically, managed identically, with the loss kept at exactly the planned 1R.
Practice drill: the target that is not there
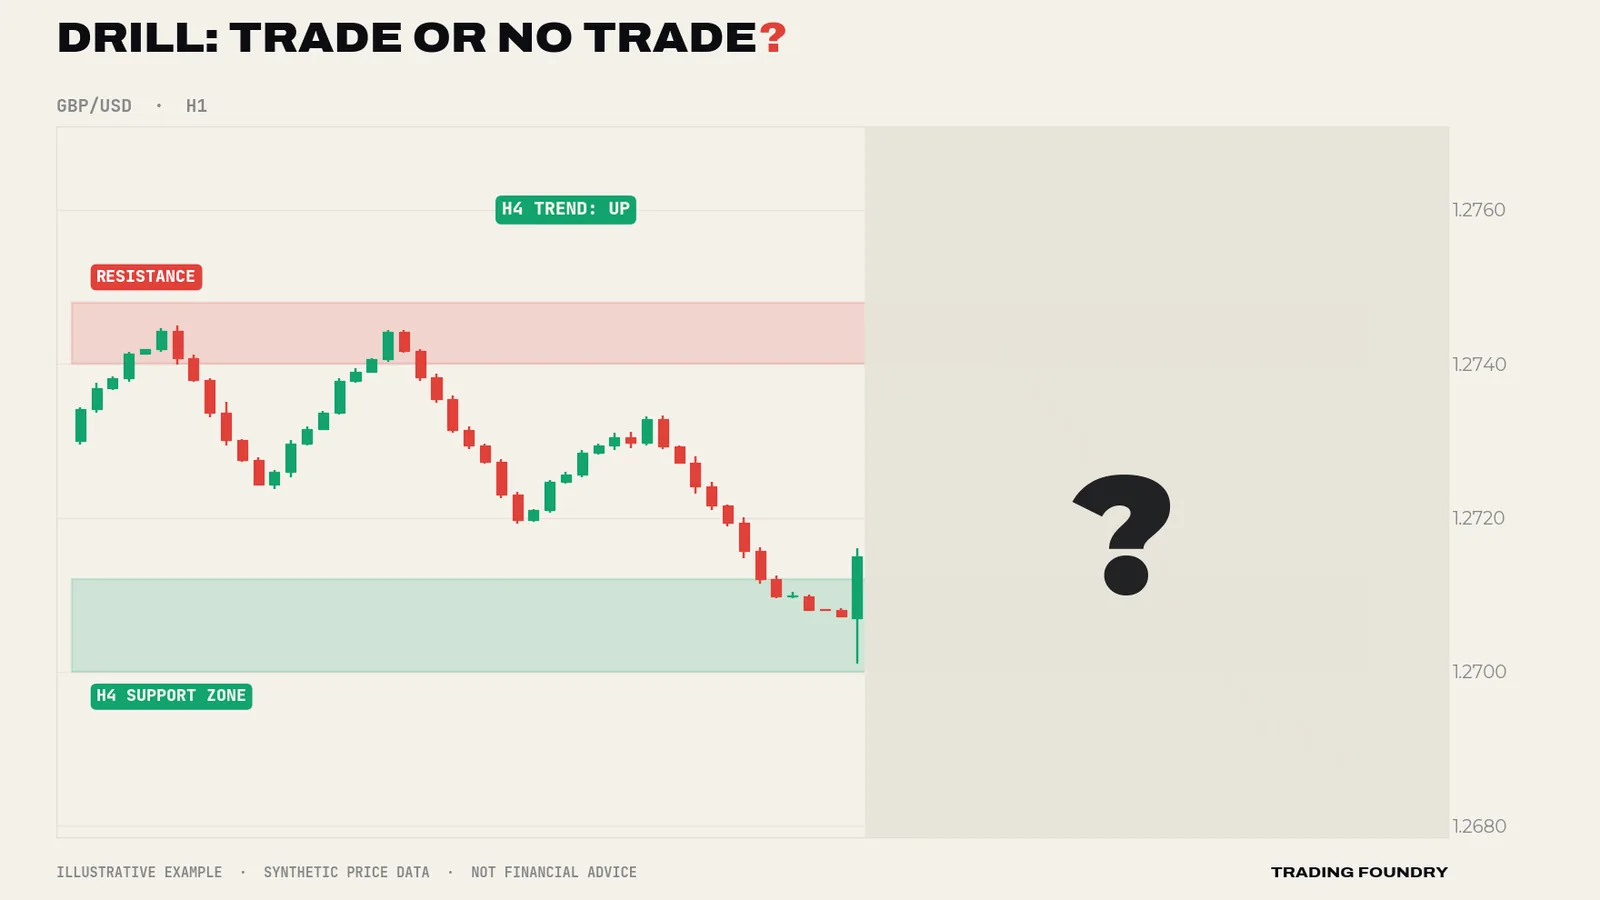
No trade. The trend, the zone and the pin bar all qualify. But measure it: a buy stop at about 1.2718 with a stop at 1.2698 is 20 pips, so a 2R target needs 1.2758 — and there is a resistance zone at 1.2740–1.2748 in the way, only about 1.1–1.5R from entry. The plan requires the target to be at least 2R and short of the next obstacle; this one is not. After the reveal, price rallies straight into resistance, stalls, and falls back through the stop. Skipping it was the plan working.
The strategy passport
The whole beginner plan on one card:
- Market: EUR/USD or GBP/USD. H4 for direction, H1 for timing. London morning or London–New York overlap.
- Wait for: a clear H4 trend and price pulling back into an H4 support (uptrend) or resistance (downtrend) zone.
- Trigger: a closed H1 pin bar or engulfing candle out of the zone in the trend direction; enter with a stop order 2 pips beyond it.
- Stop: beyond the zone and the candle's wick, plus a spread buffer. Size for 0.5–1% risk.
- Target: the next opposing level, at least 2R away. If the next obstacle is closer, there is no trade.
- Avoid: ranges, unclear structure, high-impact news windows, wide spreads, more than one open trade, and anything you cannot size before clicking.
- Economic calendar checked; no high-impact news for either currency within 30 minutes
- Trading during the London morning (after the first 30–60 minutes) or the London–New York overlap
- H4 structure labelled: clear uptrend or downtrend (not a range)
- Price is in an H4 zone that agrees with the trend (support for longs, resistance for shorts)
- A closed H1 pin bar or engulfing candle points with the trend
- Entry stop order placed 2 pips beyond the signal candle
- Stop beyond the zone and wick, plus spread buffer; distance measured in pips
- Target at the next opposing level and at least 2R from entry
- All-in cost under a fifth of the stop
- Position size calculated for 0.5–1% risk, rounded down, checked backwards
- No other trade open; fewer than two losses today
- Entry, stop-loss and take-profit placed together
- Journal entry started with a screenshot
How to practise this plan
- Backtest by hand. Scroll back through six to twelve months of H4 and H1 charts on one pair. Every time the checklist would have been met, record the trade in R. Be strict; record the losers honestly.
- Demo trade for at least 50 trades. Follow the plan exactly, in real time, with the position sizes you would actually use. Journal every trade.
- Review every 20 trades. Did you follow the plan? Where did you break it? What would the results have been if you had not?
- Only then go live, at the smallest size. Risk 0.5% or less at first. Your first live trades are about learning to follow the plan with real money at stake, not about income.
Going deeper
What this plan is, and is not. It is a sound learning framework that puts the core ideas of trend, location, trigger and risk into one routine. It is not a finished, tested strategy, and nothing in this course claims it will be profitable for you. The paid Trading Foundry courses exist to go deeper on each element: defining and filtering trends with moving averages, pullback depth and timing, support and resistance and supply and demand zones, candlestick price action, session-based day trading, and risk management in far more depth. The trend pullback course, in particular, is the natural next step from this plan.
Measure everything in R. Keep your journal in R-multiples. After 50 or 100 trades, calculate your win rate, average win, average loss and expectancy (Lesson 11). If average losses are larger than 1R, the problem is execution, not the setup. If you are taking trades outside the checklist, the problem is discipline. Both are fixable, and only a journal will tell you which you have.
Change one thing at a time. When you do start to refine the plan — a different trigger, a trailing exit, a third timeframe — change one rule, then trade at least another 30 to 50 trades before judging it. Changing several things at once leaves you unable to say what helped.
Expect the boring parts. Most sessions under this plan end with no trade. Most of the work is waiting at levels for candles that never form. That is not the plan failing; it is the plan filtering. Traders who cannot tolerate boredom tend to lower their standards until they are trading noise.
- Follow the written plan exactly; any change is made between sessions, never during a trade
- Trade only when every checklist item is met
- 0.5–1% risk per trade, one trade at a time, stop for the day after two losses
- Minimum 2R target, short of the next opposing level
- At least 50 demo trades, journalled in R, before trading live at minimum size
Summary
- A plan answers eight questions — what, when, timeframes, conditions, location, trigger, stop and target with size, and limits — and must be written down.
- The playbook runs from calendar and H4 structure, through waiting at zones, to an H1 trigger, measurement, sizing and three orders placed together.
- In the worked trades, two winners made +2R each and the loser cost exactly −1R; the process, not the result, is the lesson.
- The drill shows the plan filtering a good-looking setup whose target was blocked by resistance.
- Practise by hand-backtesting and demo trading for at least 50 trades before going live at minimum size.
Quick quiz.
Education only, not financial advice. Charts are illustrative training examples using synthetic price data, not real market history or results.