 TRADING FOUNDRY
Support and Resistance — Marking the Levels That Matter.
Draw support and resistance as zones rather than lines, grade a level's strength, recognise role reversal, and know when a level has failed.
If you asked a room of experienced traders, using very different methods, to name one tool they all rely on, most would say the same thing: support and resistance. It is the oldest idea in charting and it is still the most useful. It tells you where price has turned before, and therefore where it is most likely to react again.
It is also one of the easiest tools to misuse. Beginners draw dozens of lines until the chart looks like a barcode, then any move can be "explained" after the fact. That is not analysis; it is decoration. This lesson teaches a stricter approach: few levels, drawn as zones, graded by evidence, and used only in the context of the trend you identified in Lesson 8.
What support and resistance are
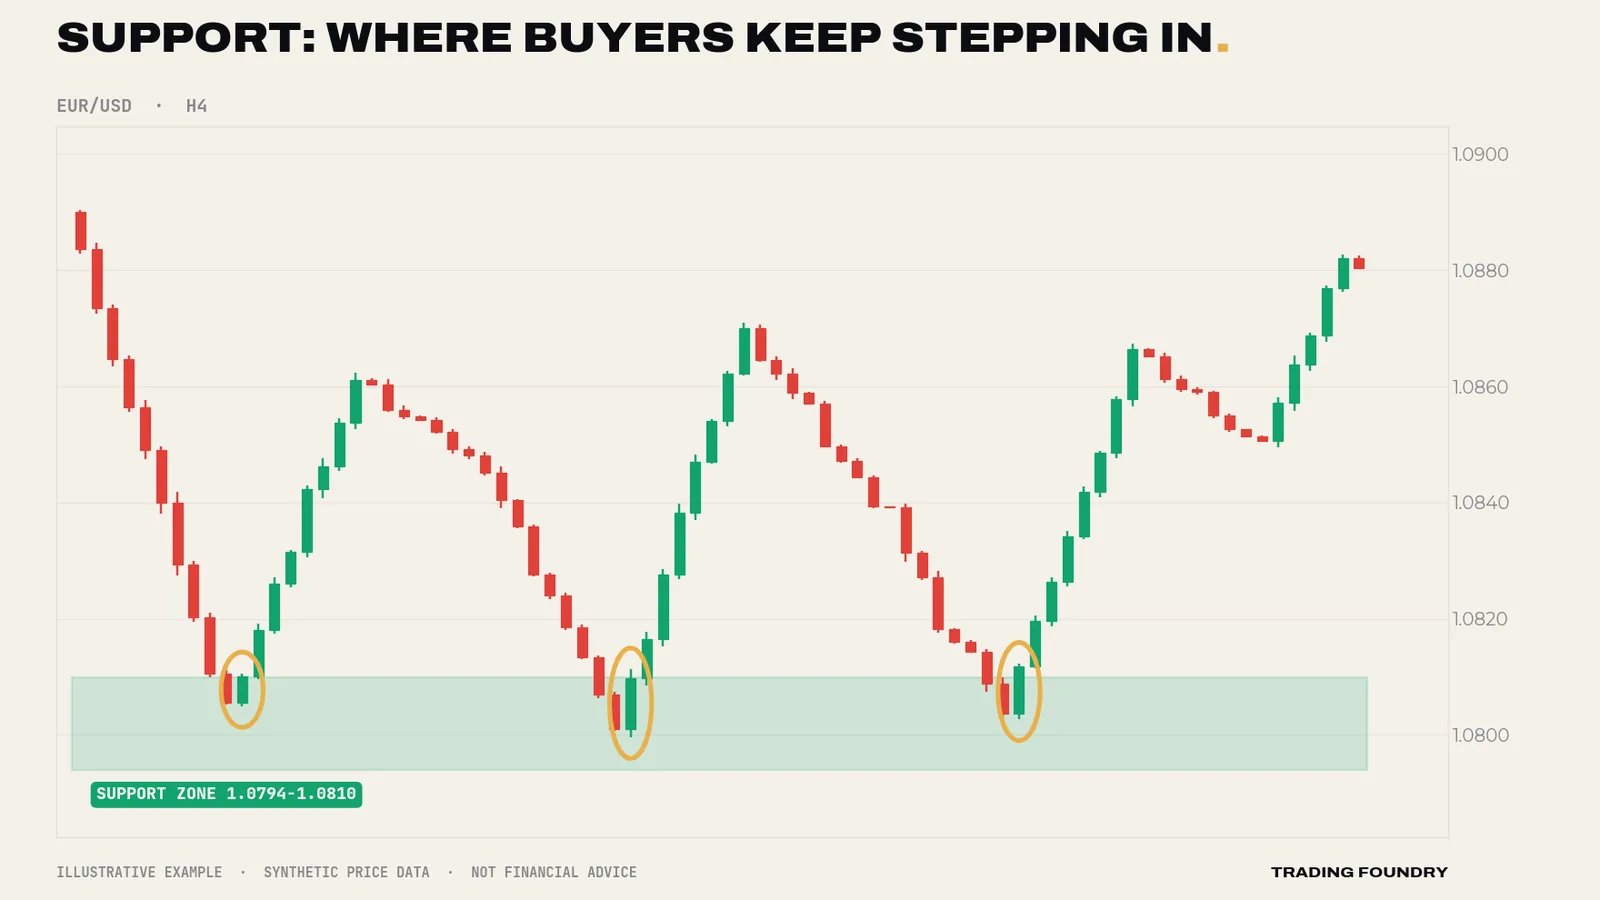
Support is a price area where falling prices have repeatedly stopped and turned up. Buyers have stepped in there before.
Resistance is a price area where rising prices have repeatedly stopped and turned down. Sellers have stepped in there before.
Why would price remember a level at all? There are a few plausible, ordinary reasons. Traders who bought at a level and saw price rise are inclined to buy there again. Traders who missed the first move wait for a return to get in. Traders who bought just before a fall and endured a loss are inclined to sell when price comes back to their entry, to get out flat. Orders cluster around round numbers and obvious turning points. None of this needs a conspiracy; it is simply many people looking at the same chart and remembering the same prices.
Zones, not lines
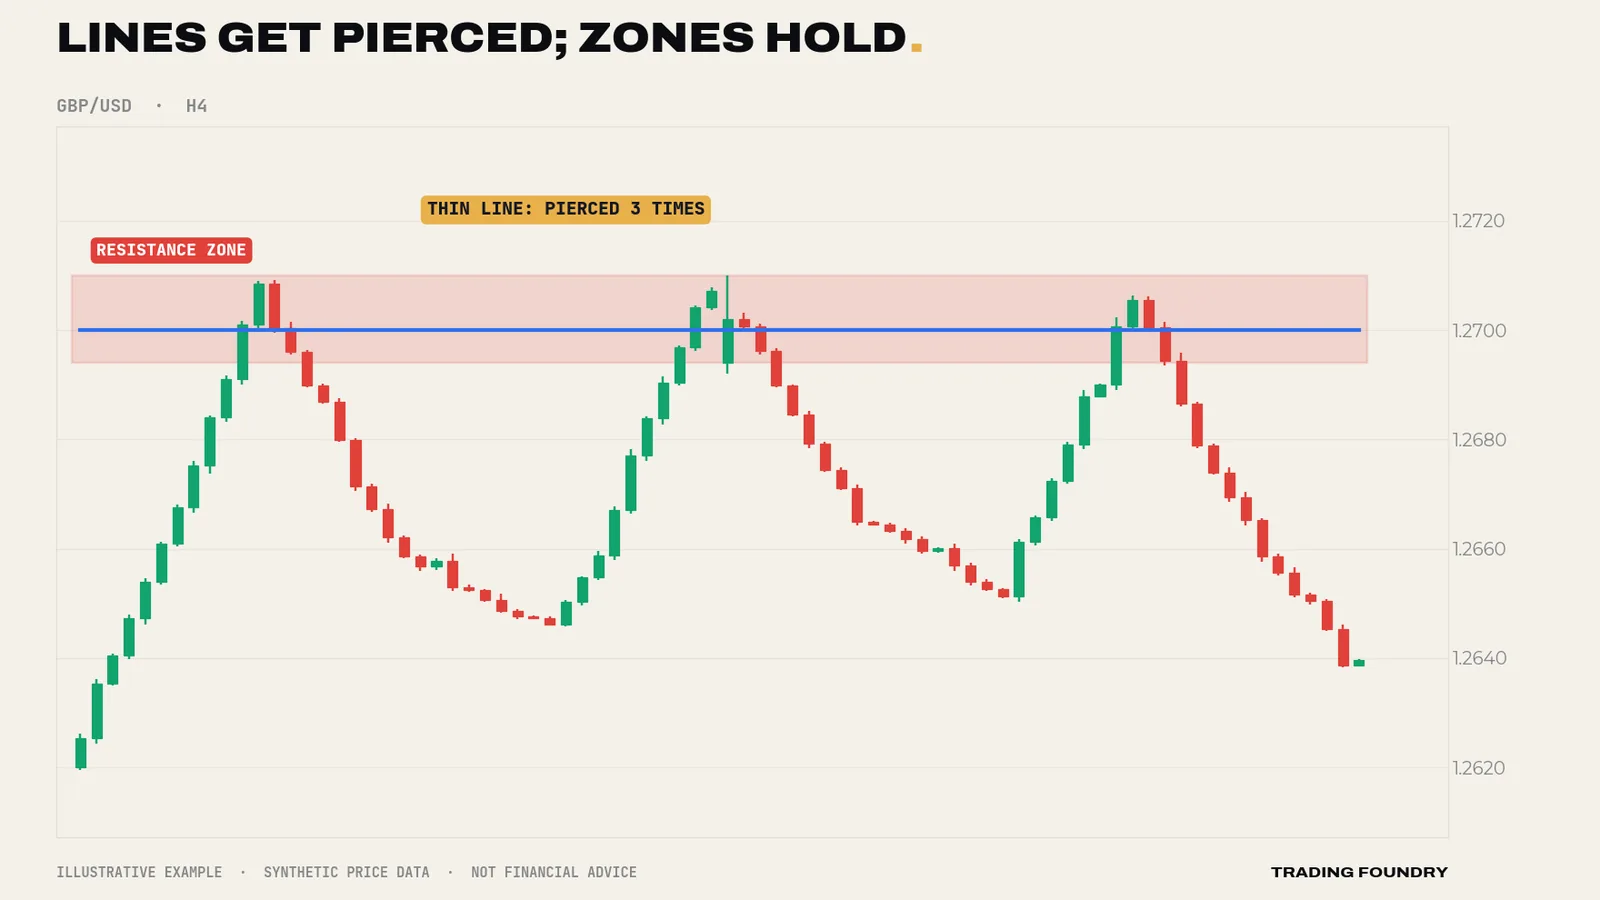
Price is not precise. A level that turned the market three times did not turn it at exactly the same price each time: once the low was 1.0796, once 1.0802, once 1.0808. A single thin line forces you to pick one of those numbers, and price will spend its time poking through your line by a few pips and making you doubt it.
So draw zones: a band that covers the cluster of turning points. A useful starting rule on H4 is to draw the zone from the extreme wick to the area where the candle bodies turned. On the major pairs that usually gives a zone of roughly 10 to 25 pips. If your zone is 60 pips deep, it is not a level; it is a region, and you need a tighter definition.
How to draw your levels: a routine
Keep it simple and repeatable. On your direction timeframe (H4 in this course):
- Zoom out to show roughly two to three months of H4 candles.
- Find the obvious turning points — the swing highs and lows you would point to without hesitation.
- Look for clusters: places where two or more turning points line up horizontally.
- Draw a zone over each cluster, from the extreme wicks to where the bodies turned.
- Keep only the nearest two or three levels above price and the nearest two or three below. Delete the rest.
That last step matters. The levels that matter for your next trade are the ones price can reach in the next few days. A level 400 pips away is history, not information.
Grading a level
Not all levels are equal. Before you rely on one, grade it on a few simple questions:
- How many times has it turned price? Two clean reactions is a level; three or more is a strong one.
- How sharply did price leave? A strong move away shows real interest. A slow drift away shows little.
- How visible is it? Levels obvious on H4 and D1 are watched by more people than those only visible on M15.
- Is it a round number? Levels such as 1.1000 or 150.00 attract orders and attention.
- Does it agree with the trend? In an uptrend, support zones where price might resume higher are the interesting ones. In a downtrend, resistance zones.
Role reversal: broken resistance becomes support
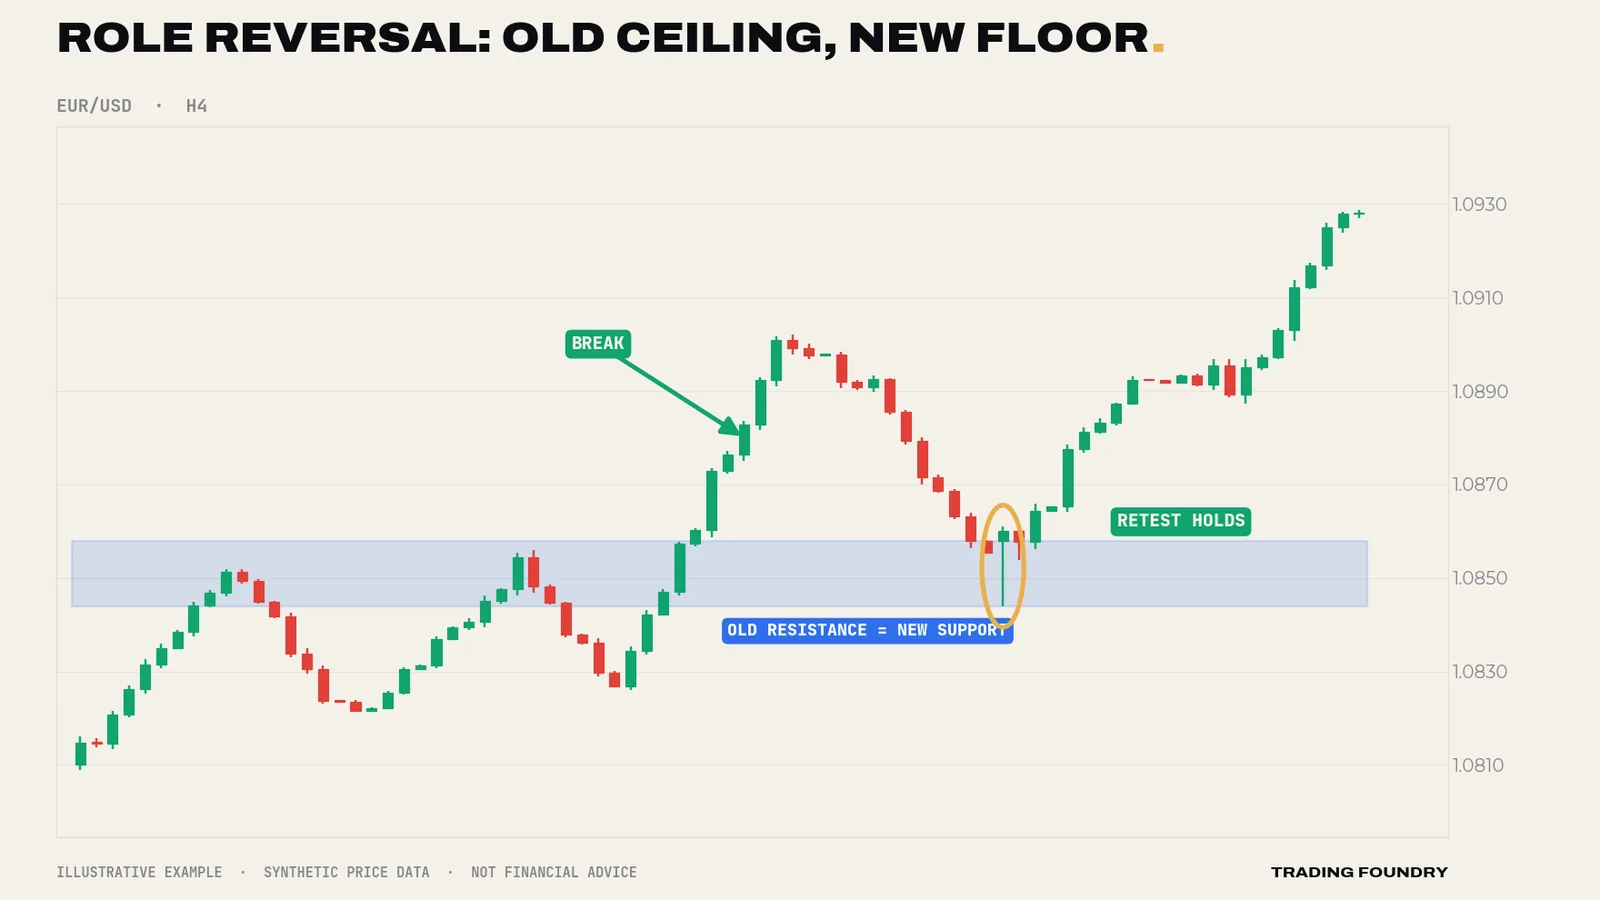
When price breaks decisively through a level, that level often changes role. Old resistance, once broken, tends to act as support when price comes back to it; old support, once broken, tends to act as resistance. Traders who sold at resistance and were proven wrong are keen to exit near their entry, and traders who missed the breakout get a second chance to buy.
When a level fails
A level fails when price closes decisively through it and keeps going. On H4, a useful rule is: a candle body closing clearly beyond the zone, followed by a second candle that does not reclaim it. A wick poking through and snapping back is not a failure — that is often the level doing its job.
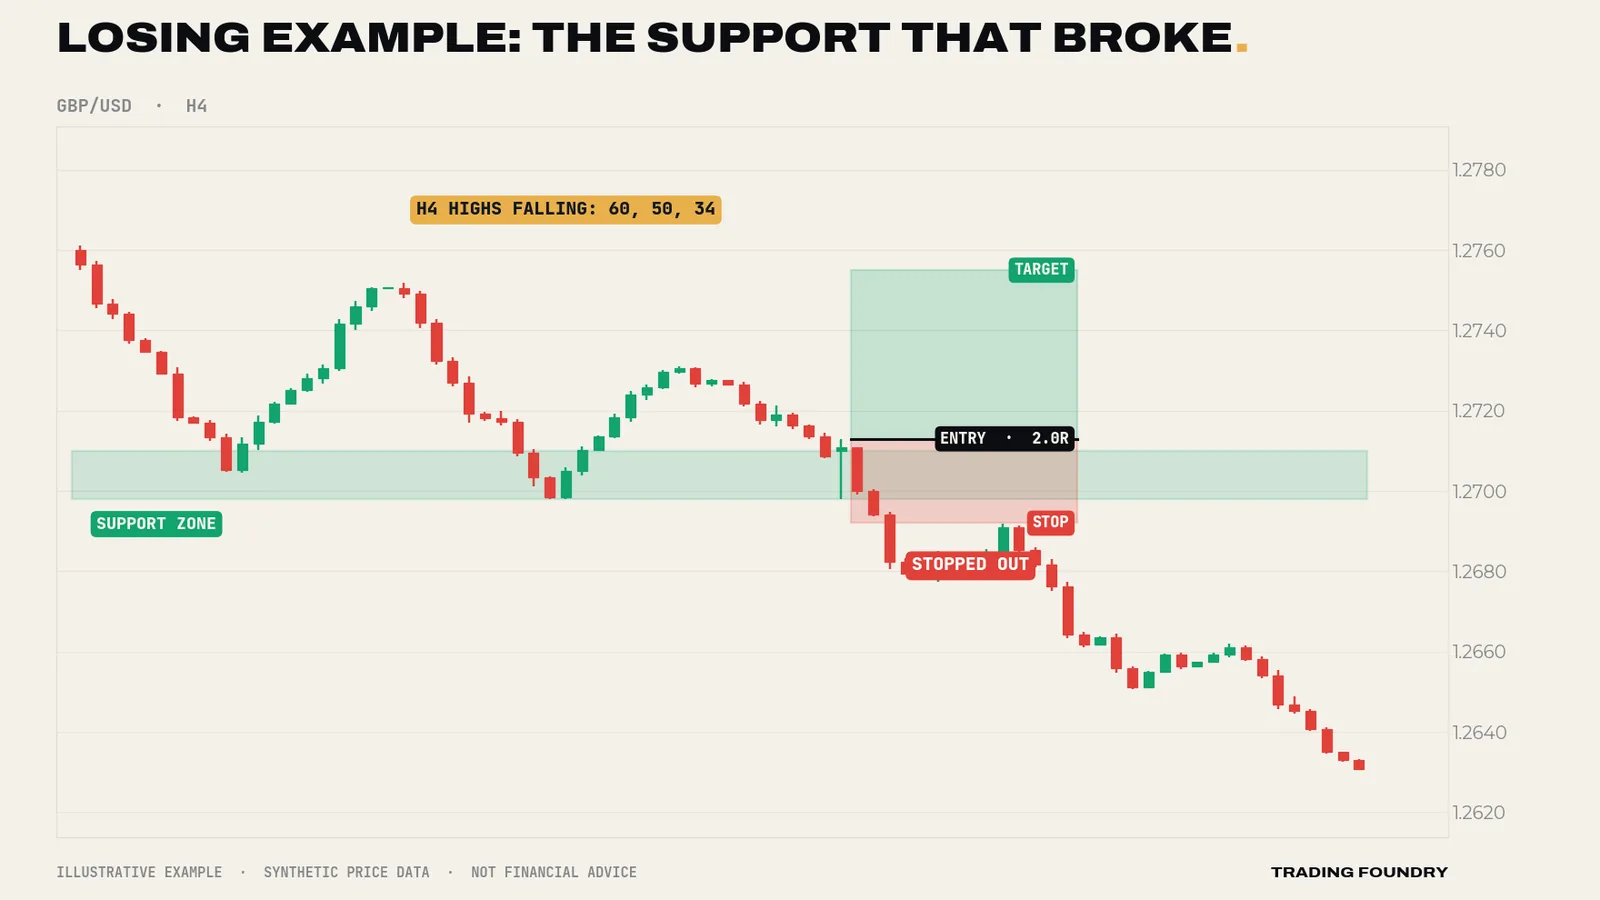
That losing trade is not a failure of the method. Levels fail, and that is exactly why the stop sits beyond the zone. But the chart did offer a warning: each rally from support was weaker than the one before, and the H4 structure was making lower highs. A support zone inside a market making lower highs is being leaned on, and buying it is buying against the structure.
Practice drill
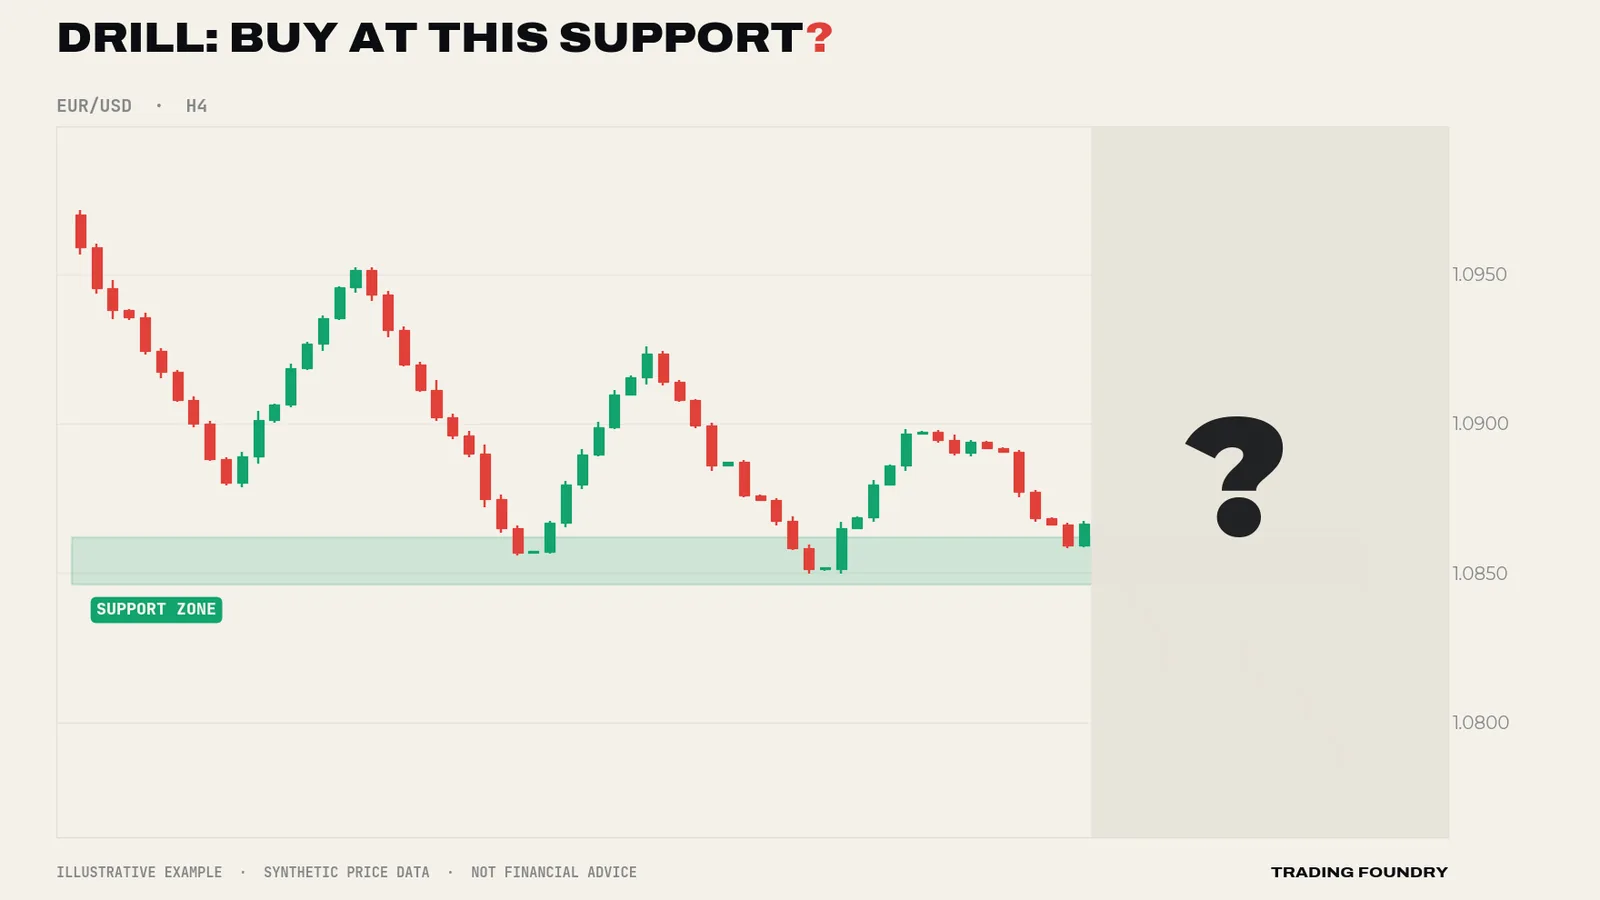
No trade. The zone has held twice, which looks attractive, but read the structure: the highs went 120, 100, 72, 50 — a clear run of lower highs. The H4 chart is in a downtrend, and each bounce from support is weaker. Under this course's rules you only buy in an uptrend, so a long here is against the structure. After the reveal, the zone gives way and price falls a further 60 pips. A downtrend trader would have treated the broken zone as future resistance instead.
A worked example of marking a chart
Suppose GBP/USD is trading at 1.2715 on H4, and you are preparing for the week. You zoom out to about ten weeks of candles and see:
- three clear turning points between 1.2648 and 1.2660 over the past month, each followed by a rally of at least 60 pips;
- two swing highs at 1.2788 and 1.2797, each followed by a sharp sell-off;
- a former ceiling around 1.2700–1.2712 that price broke through a week ago and has not yet revisited;
- assorted smaller wiggles everywhere else.
You draw three zones: 1.2648–1.2660 (support, three reactions — strong), 1.2700–1.2712 (old resistance, possible new support — untested since the break), and 1.2786–1.2800 (resistance, two reactions, near the round number 1.2800). You ignore the smaller wiggles.
Now you have a map. If the H4 trend is up, the interesting places for a buy are the 1.2700 zone (if price pulls back to it) and the 1.2650 zone below that. The obvious first target for any long is the 1.2790s. If price is sitting at 1.2715 right now, it is already just above the first zone — so the job is to wait, not to act. That is what most of good chart work looks like.
Going deeper
Levels as decision points, not predictions. Professional use of support and resistance is less "price will bounce here" and more "this is where I will find out who is in control". At a level, you have a nearby, logical place for a stop (just beyond the zone) and a clear test. That improves the geometry of a trade even if it does not change the odds very much.
Liquidity around obvious levels. Because many traders place stops just beyond obvious levels, price sometimes pokes through a level, triggers those stops, and then reverses. This is why stops placed right on the edge of a zone get hit so often, and why this course places stops beyond the zone and beyond the trigger candle's wick, with a small buffer for the spread.
Psychological levels. Round numbers (1.1000, 1.2500, 150.00) behave like levels even without prior history, because orders and option interest cluster there. Treat them as an extra reason a zone is important, not as levels to trade on their own.
Fewer levels, better levels. If you have more than about six zones on your H4 chart, you have too many. Every extra level is another excuse to see a trade that is not there.
- Draw support and resistance as zones (typically 10–25 pips on H4 majors), not single lines
- Keep only the nearest two or three zones above and below price
- Only buy at support in an H4 uptrend and only sell at resistance in an H4 downtrend
- Stops go beyond the zone and the trigger candle's wick, never inside the zone
- A level has failed when an H4 body closes clearly beyond it and the next candle does not reclaim it
Summary
- Support is where falling price has repeatedly turned up; resistance is where rising price has repeatedly turned down.
- Draw zones over the cluster of reactions, not thin lines through one price.
- Grade levels by number of reactions, strength of departure, visibility, round numbers and agreement with the trend.
- Broken levels often change role: old resistance becomes support and vice versa.
- Levels fail; a series of weakening bounces is a warning, and the stop beyond the zone is what limits the damage.
Quick quiz.
Education only, not financial advice. Charts are illustrative training examples using synthetic price data, not real market history or results.