 TRADING FOUNDRY
Why Levels Exist — The Market's Order Memory.
Explain in plain English why price keeps reacting at the same areas, and use that explanation to judge which areas are likely to matter again.
Open any chart, on any pair, on any timeframe, and you will see it within a minute. Price falls to an area, turns, wanders away, comes back weeks later — and turns again from almost exactly the same place. It looks like the chart has a memory. It looks, frankly, a bit like magic.
It isn't magic, and the reason matters. If you only know that levels work, you will draw them everywhere and trust them equally. If you know why they work, you can tell the difference between an area where real orders are likely still waiting and an area that simply has a line on it because you put one there.
This course teaches a complete, practical method for support and resistance: how to find the areas that matter, draw them honestly as zones, rank them, read what price does when it arrives, and plan trades with a stop, a target and a reason. This first lesson is the foundation under all of it — the mechanics of why a price level can matter at all.
A chart is a record of decisions
Every candle on your chart is the footprint of an auction. Buyers and sellers meet, trade happens, and the price moves to wherever the two sides can agree. Most of the time that agreement drifts around without much drama. But at certain prices, something different happens: the market turns sharply, as if it hit something.
What it hit was a concentration of orders. Somewhere around that price, enough buyers (at a low) or sellers (at a high) were waiting that the side pushing price could not get through. The push ran out of fuel, the other side took over, and price reversed.
Here is the important part. Those orders do not all disappear when price leaves. Some were filled. Some were cancelled. But many participants were left with unfinished business at that price, and the market keeps a kind of memory of it.
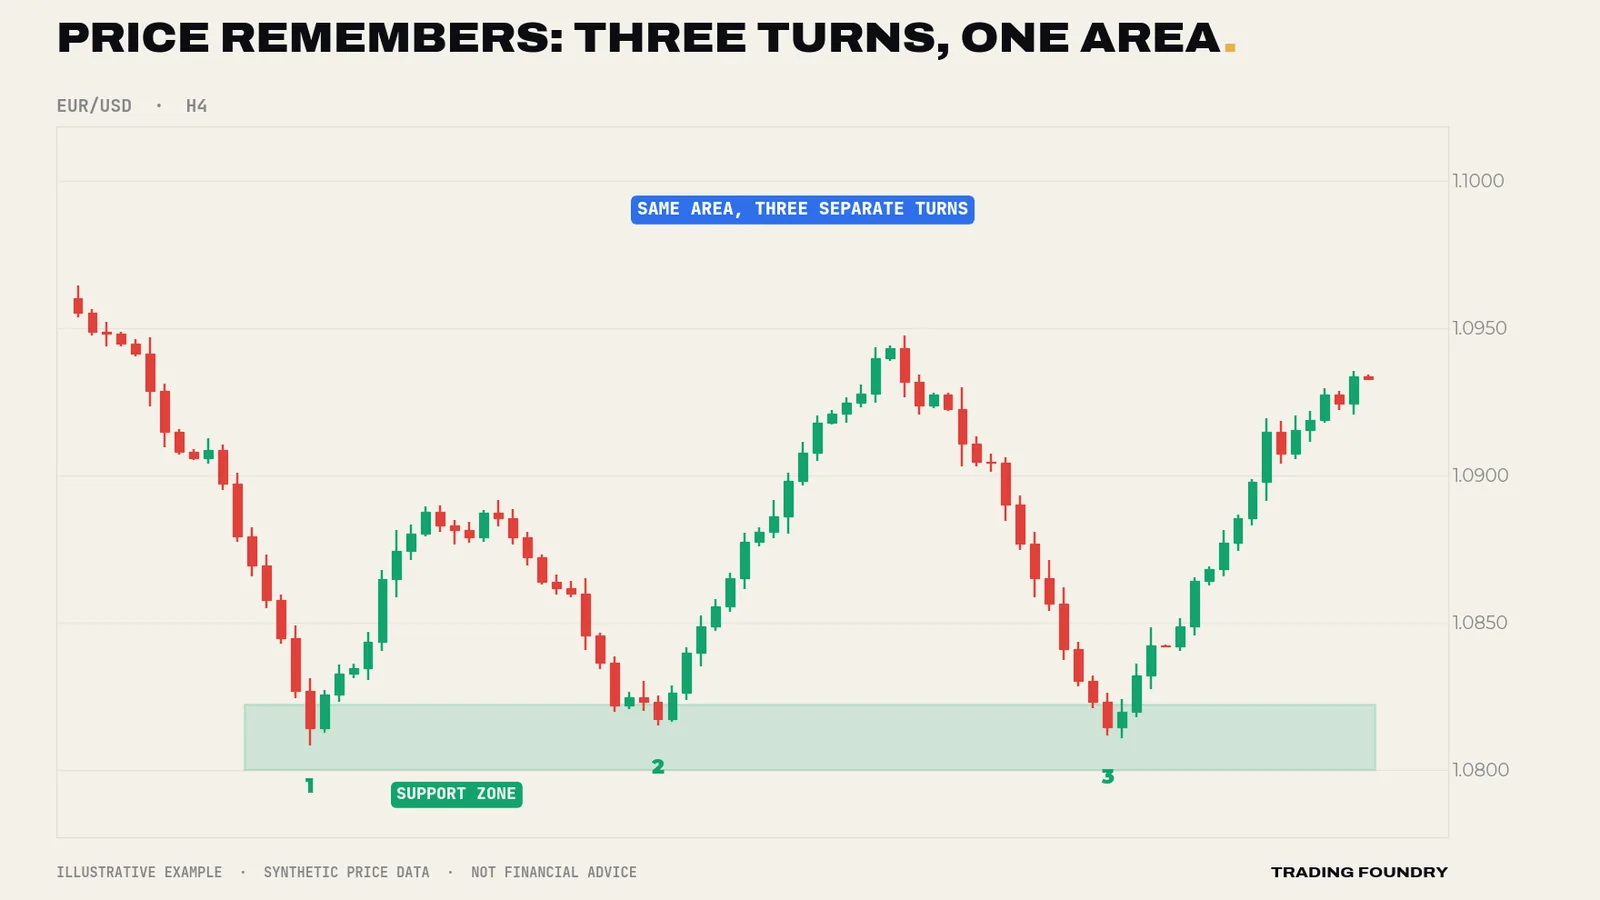
Three groups with unfinished business
Think about who is left with an opinion after price turns sharply from a low. There are three groups, and each one gives the area a reason to matter again.
1. The buyers who got filled and want more. Someone bought heavily near the low and was rewarded. If price returns to the same area, the same logic that made them buy still applies — and now they have proof it worked. Many will buy again.
2. The buyers who missed it. Some traders saw the turn and hesitated. They watched price rally without them. If price comes back to the area, they get the second chance they have been hoping for, and they take it. This is the regret effect, and it is one of the most reliable forces on a chart.
3. The sellers who were caught. Traders who sold into the low watched the market turn against them. Many are still holding, hoping. If price comes back to where they sold, they finally get the chance to close at breakeven — and closing a short means buying. Their relief adds to the demand.
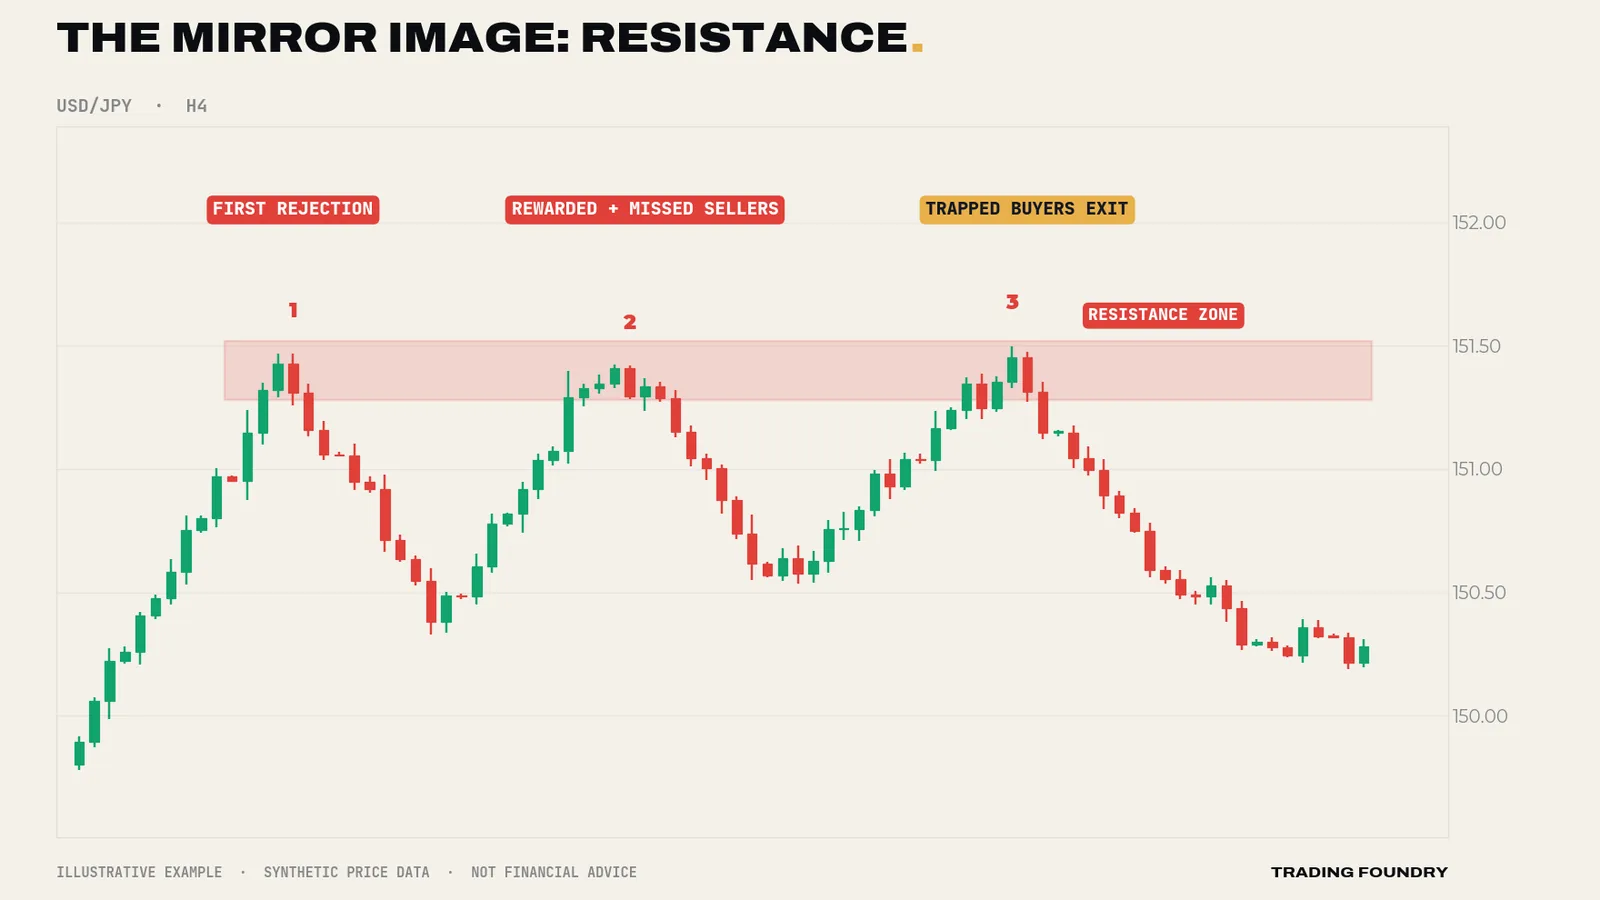
All three groups do the same thing when price returns: they buy. That is support. Flip every word and you have resistance: sellers who were rewarded, sellers who missed it, and trapped buyers looking for an exit, all selling when price comes back up to the area.
When price leaves in a hurry
The strongest memories are made when price leaves an area quickly. Think about why. If price drifted slowly through a level, everyone who wanted to trade there had time to do so. The business was finished. But if price exploded away from an area in a few large candles, a great many orders were never filled. Buyers who planned to buy there did not get the chance. The market left without them.
That makes the speed of departure one of the best clues you have about whether an area will matter again.
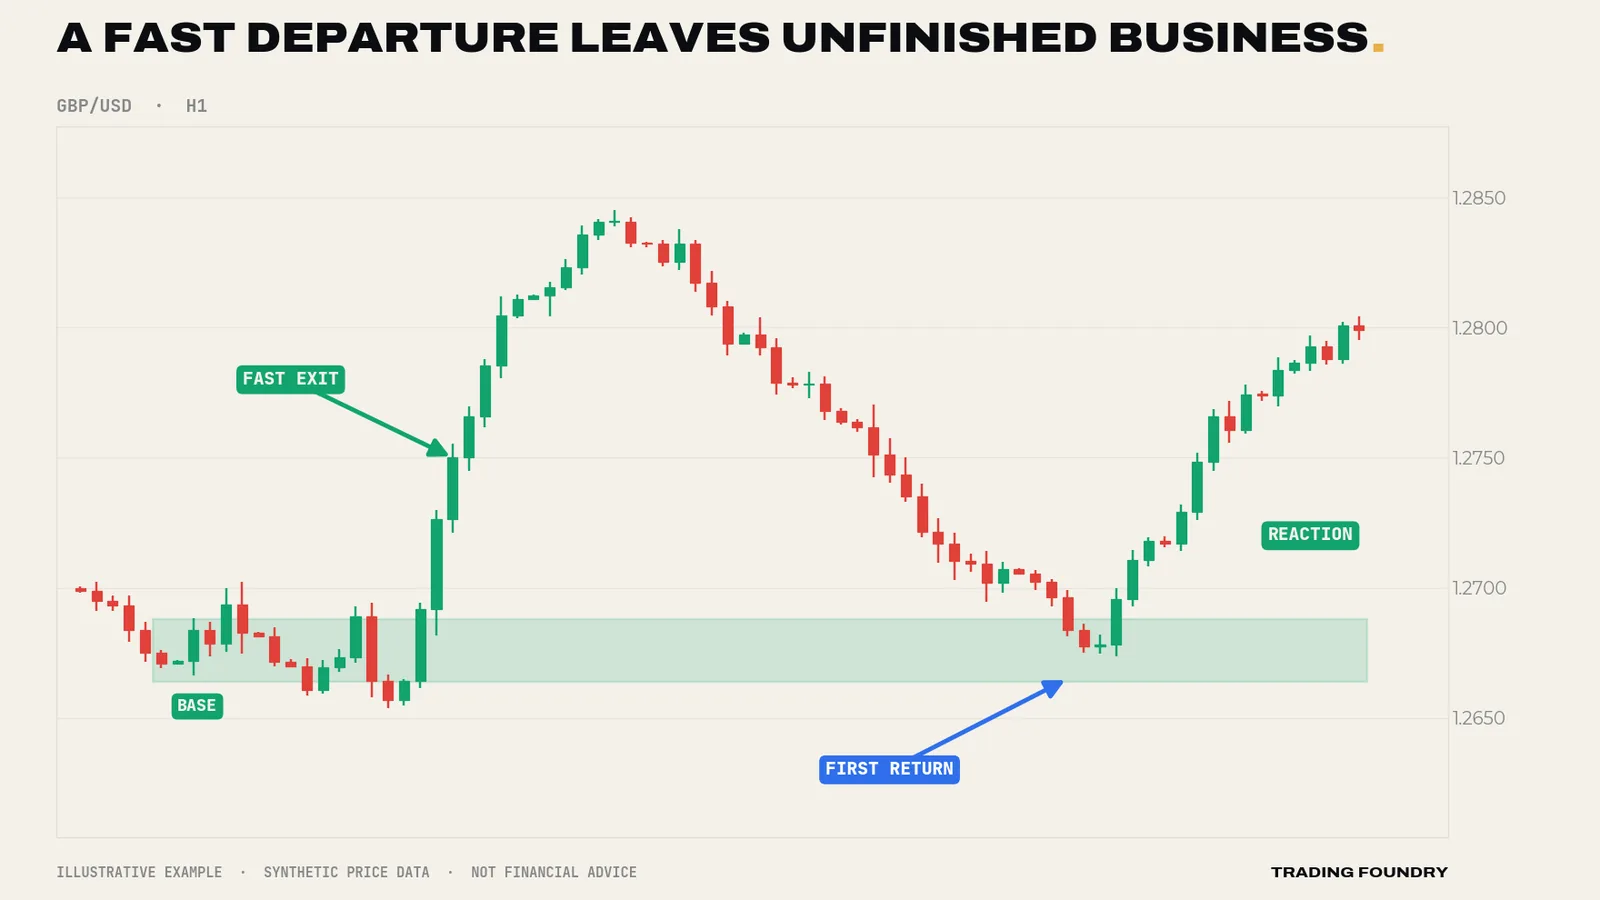
Compare that with an area price wandered through slowly, back and forth, for days. There is nothing unfinished there. Everyone who wanted to trade at that price had plenty of opportunity. When price returns to such an area, there is no particular reason for anything to happen — and usually nothing does.
Stop orders: the other half of the story
There is a second group of orders around every level, and beginners rarely think about them. When traders buy at support, most place their stop-loss a little below it. When traders sell at resistance, they place stops a little above it. So just beyond every obvious level sits a cluster of stop orders.
A stop order is a market order waiting to be triggered. A sell stop below support, once hit, sells at whatever price is available. That has two consequences you will study in detail later in the course:
- Price is often drawn slightly through obvious levels. The stops beyond them are a pool of guaranteed orders, and larger traders who need to buy in size can use that burst of forced selling to fill their own orders. Price dips through the level, triggers the stops, then snaps back. This is the false break, and Lesson 7 is devoted to it.
- When a level genuinely fails, the move accelerates. If there is no real buyer left behind support, the triggered stops feed on themselves and price falls quickly. Same trigger, opposite result. The difference is whether real interest was still waiting.
This is why we will never treat a level as a wall. A level is a neighbourhood where orders cluster, with fuel stored just outside it.
Every visit spends some of the memory
You will often hear that "the more times a level is tested, the stronger it becomes." Be careful with that. Every time price visits a support area, some of the waiting buy orders get filled. The ones that remain are fewer. Unless fresh buyers keep arriving, each visit leaves the area a little emptier than the last.
You can usually see this happening. The bounces get smaller. Price returns sooner. The reactions look tired.
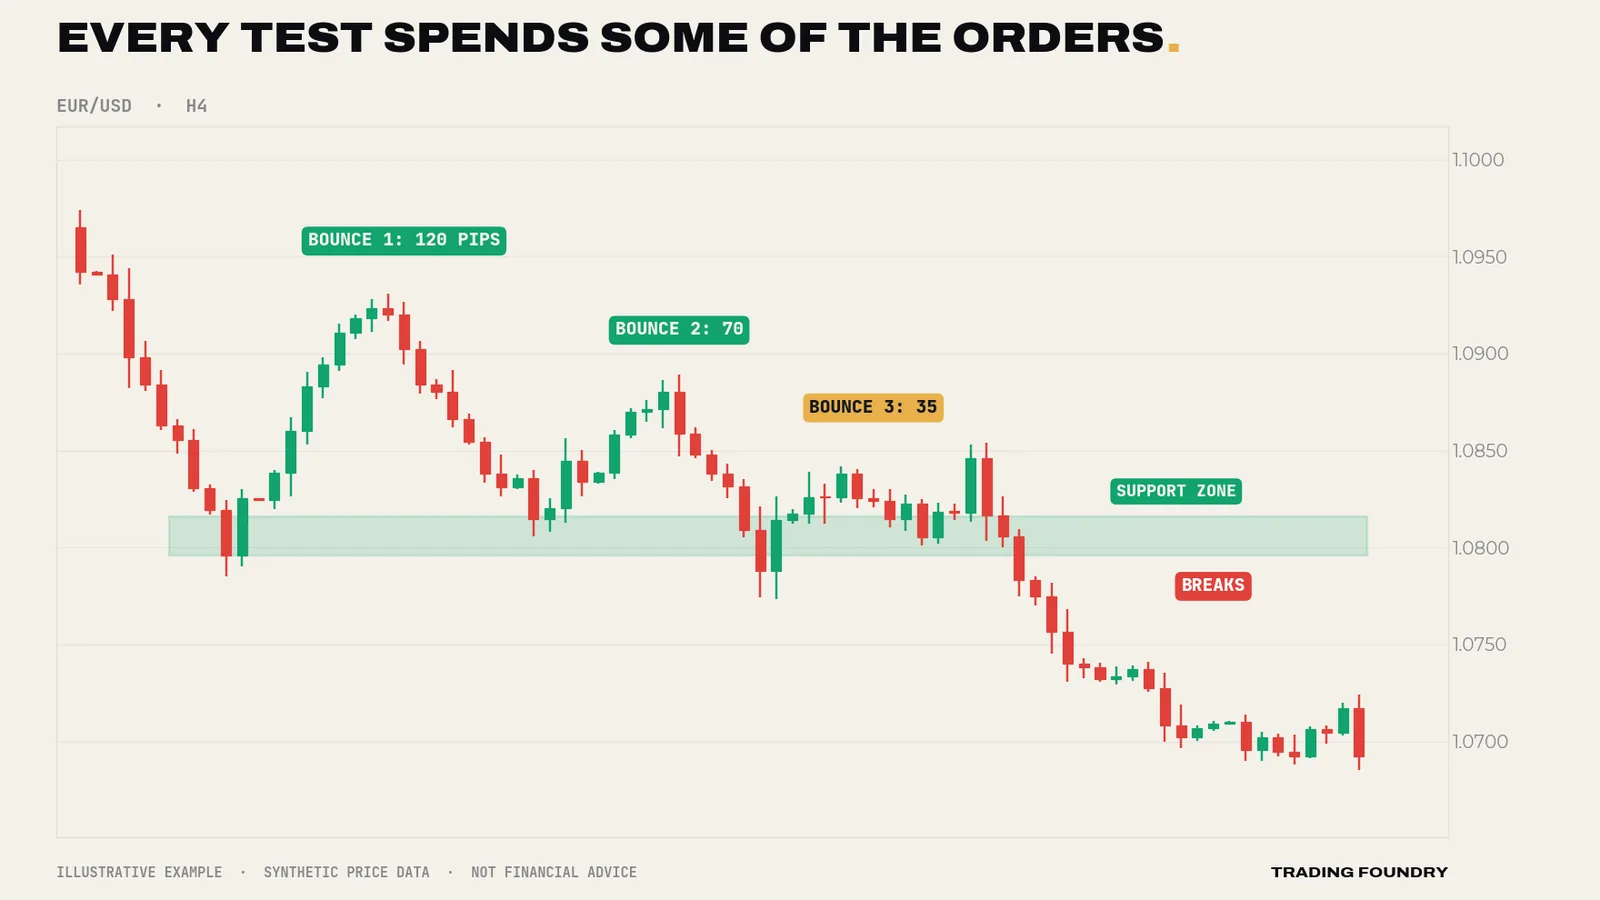
That does not mean a level touched three times is useless. It means the character of the visits matters more than the count. A strong, sharp reaction on a fresh area is a very different thing from a fourth weary bounce. Lesson 4 turns this into a ranking system.
What this means for the rest of the course
Put these ideas together and you already have the logic of the whole method:
- Look for areas price left quickly. That is where unfinished business lives.
- Draw them as areas, not exact prices. Orders are spread across a range, and stops sit just beyond. Lesson 2 shows you exactly how.
- Prefer fresh areas over tired ones. Each visit spends some of the memory.
- Expect price to probe slightly beyond obvious levels. Stops are stored there, and they get used.
- Never trade a level on faith. A level tells you where to pay attention. What price does when it gets there tells you whether to act.
That last point is the one that separates level traders who survive from those who don't. A support zone is a location, not a signal. Price arriving at support is not a reason to buy. Price arriving at support and then showing you that buyers are actually there — that is the beginning of a reason. The final module of this course is about exactly that evidence.
Going deeper
Experienced traders sometimes object that the "memory" explanation is too tidy. Orders get cancelled; the traders who bought at a low three months ago may have long since closed their positions; the order book you cannot see on a spot forex chart may look nothing like you imagine. All true. So why does the effect persist?
Partly because it is self-reinforcing. A level that is obvious on a daily chart is visible to everyone who looks at that chart. Enough participants expect a reaction there that they act on that expectation — placing buy orders, tightening stops, taking profit on shorts. The expectation produces the reaction. This is why visibility matters so much. A level that only you can see, found by zooming in and squinting, has no crowd behind it. A level that jumps off the chart has thousands.
It is also why higher timeframes carry more weight. A turn on a daily chart represents far more volume and far more participants than a turn on a five-minute chart. More participants means more unfinished business and more people watching. When a five-minute level and a daily level disagree, the daily level usually wins.
Two further caveats keep the idea honest:
Levels decay. A swing low from three years ago, in a completely different interest-rate regime, has fewer participants with any stake in it. Recent levels — and old levels that have recently been respected — usually matter more.
News overrides memory. A major data release or central-bank surprise can move price straight through any level without the usual reaction, because the new information changes what everyone thinks the currency is worth. Levels describe the market's memory of the past; they cannot protect you from new information. Many level traders simply stand aside around high-impact releases.
Finally, keep in mind what this course is and is not claiming. Support and resistance improves the location of your decisions: it tells you where the odds of a reaction are better than average and where your risk can be clearly defined. It does not tell you what will happen. Every example in this course comes with a stop for that reason. All charts here are illustrative training charts, built to show the concept clearly — real markets are messier, and you should expect that.
- A level is a location, not a signal. Never act on price arriving at a level without evidence of a reaction.
- Always treat levels as areas with stops clustered just beyond them.
- Judge a level by the quality of past reactions and how quickly price left it, not by how many times it was touched.
- Stand aside from level-based entries around high-impact news unless you have a separate, tested plan for it.
Summary
- Levels exist because traders are left with unfinished business there: orders to repeat, missed chances to take, and losing positions to escape.
- Areas that price left quickly hold the most unfilled orders and are most likely to matter again.
- Stop orders cluster just beyond obvious levels, which explains both false breaks and fast genuine breaks.
- Every visit spends some of the orders at a level; weakening bounces are a warning, not a strength.
- A level tells you where to look. Price behaviour at the level tells you whether to act.
Quick quiz.
Education only, not financial advice. Charts are illustrative training examples using synthetic price data, not real market history or results.