 TRADING FOUNDRY
What MACD Actually Measures.
Read the MACD line, signal line and histogram as what they really are — a speed reading and an acceleration reading of price — rather than as buy and sell lights.
Most traders meet MACD as a pair of wiggly lines under the chart and a rule somebody posted online: buy when the blue line crosses above the orange one, sell when it crosses back. They try it, it works brilliantly on the three examples in the video, and then it quietly bleeds their account in the following month. The usual conclusion is that MACD "doesn't work".
MACD works perfectly. It does exactly what its arithmetic says it does, every single candle, without fail. The problem is that very few people are told what that arithmetic is. Once you know, the indicator stops being a set of traffic lights and becomes something far more useful: an honest measuring instrument for the speed of a trend and whether that speed is rising or falling.
This lesson builds that understanding from the ground up. There are no trade setups here yet. By the end, you should be able to look at any MACD pane and say, in plain English, what price has been doing — and, just as importantly, what MACD cannot possibly tell you.
Three numbers, one idea
MACD stands for Moving Average Convergence Divergence. It was developed by Gerald Appel in the late 1970s, and the histogram was added later by Thomas Aspray. Strip away the name and it is three numbers, recalculated on every candle:
- The MACD line. The 12-period exponential moving average (EMA) of the closing price, minus the 26-period EMA. That is all. When the fast average is above the slow one, the MACD line is positive. When it is below, the line is negative.
- The signal line. A 9-period EMA of the MACD line itself — an average of the difference.
- The histogram. The MACD line minus the signal line, drawn as bars.
The settings you see printed as "MACD (12, 26, 9)" are simply those three periods. Every MACD chart in this course uses them, because they are what almost every platform loads by default. Lesson 3 deals with whether changing them helps (mostly, it does not).
The name tells you the idea. The two averages converge when they move towards each other and diverge when they spread apart. The MACD line is a single number that records the gap between them.
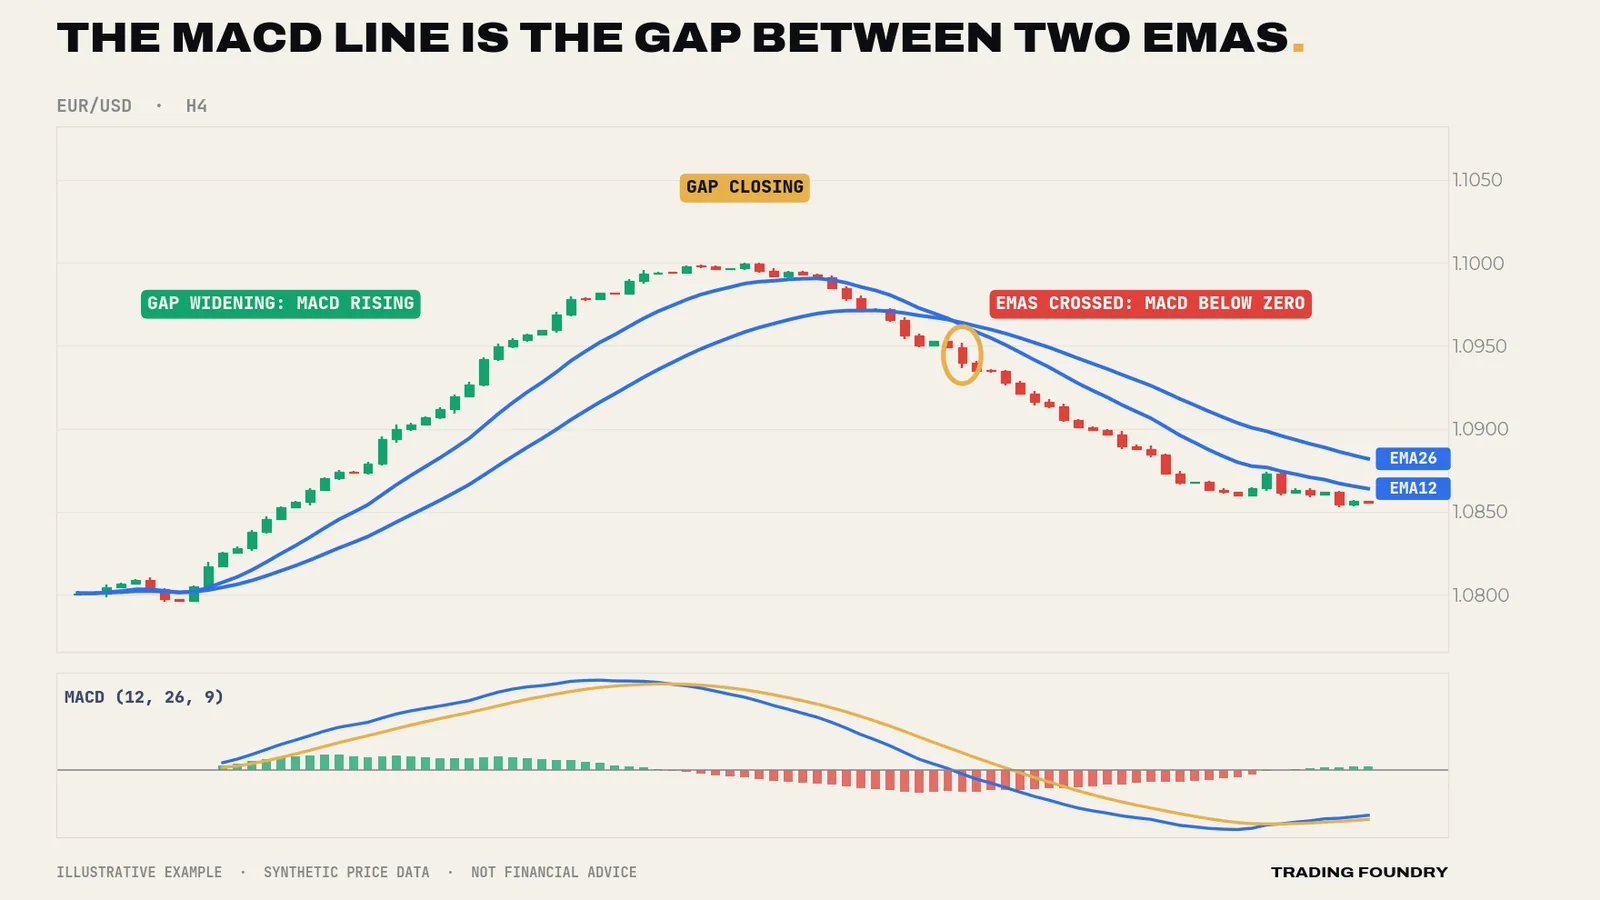
Look at the chart above slowly. The MACD pane is not adding information that the price pane does not contain. It is re-plotting one feature of the price pane — the distance between two averages — so that your eye can read it without squinting at two lines that are close together.
The MACD line is a speedometer
Why would the gap between a fast and a slow average matter? Because of lag. An EMA trails behind price, and a slower EMA trails further. In a steady trend, the 12 EMA sits a little behind price and the 26 EMA sits further behind. The faster price is travelling, the further behind both averages fall, and the wider the gap between them becomes.
So the MACD line is, in effect, a speedometer for the trend:
- A large positive value means price has been rising quickly over the last few weeks of candles.
- A small positive value means price has been rising slowly, or has stopped rising recently.
- Zero means the fast and slow averages agree — price has, on balance, gone nowhere over the lookback.
- Negative values are the same story for falling prices.
That framing immediately clears up a common confusion. A rising MACD line does not mean price is rising. It means price is rising faster than it was. A falling MACD line that is still above zero does not mean price is falling. It means the uptrend is losing speed. Price can make new highs while the MACD line falls, simply because each new high arrived more slowly than the last. Lesson 6 turns that observation into a tool called divergence.
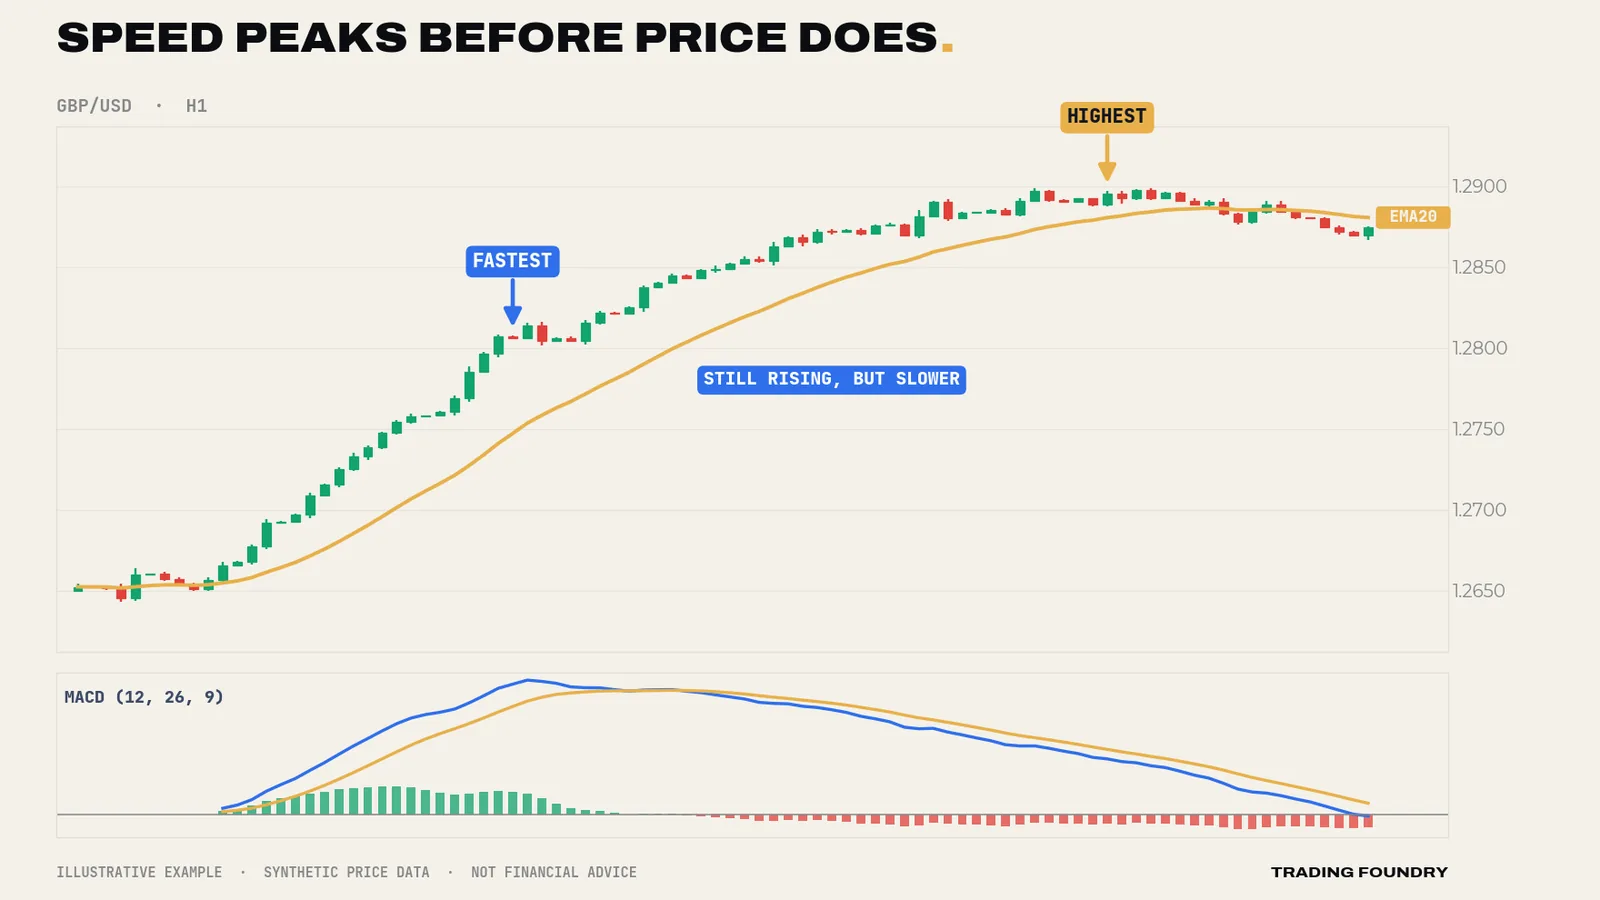
There is a simple piece of arithmetic behind this, and it is worth knowing because it removes all the mystery. An EMA lags a steady trend by roughly half its period. The 12 EMA trails by about 5.5 candles and the 26 EMA by about 12.5. In a perfectly steady trend moving k pips per candle, the gap between them settles at roughly 7 × k. A pair climbing a steady 3 pips per candle will show a MACD line of about +21 pips. Speed it up to 5 pips per candle and the reading settles near +35. The MACD line really is a speed reading, measured in pips.
The signal line and histogram: acceleration
If the MACD line is speed, the histogram is acceleration.
The signal line is an average of the MACD line over the last nine candles. Comparing the MACD line with its own recent average tells you whether speed is currently above or below what it has been lately:
- Histogram bars above zero and growing: the trend is speeding up.
- Histogram bars above zero but shrinking: still faster than the recent average, but the increase is fading.
- Histogram crossing below zero: speed has dropped below its recent average. Something is slowing.
The histogram crossing zero is exactly the same event as the famous "MACD crosses the signal line". They are one event drawn two ways. When you hear a trader talk about a "bullish crossover", they mean the histogram has turned from red to green.
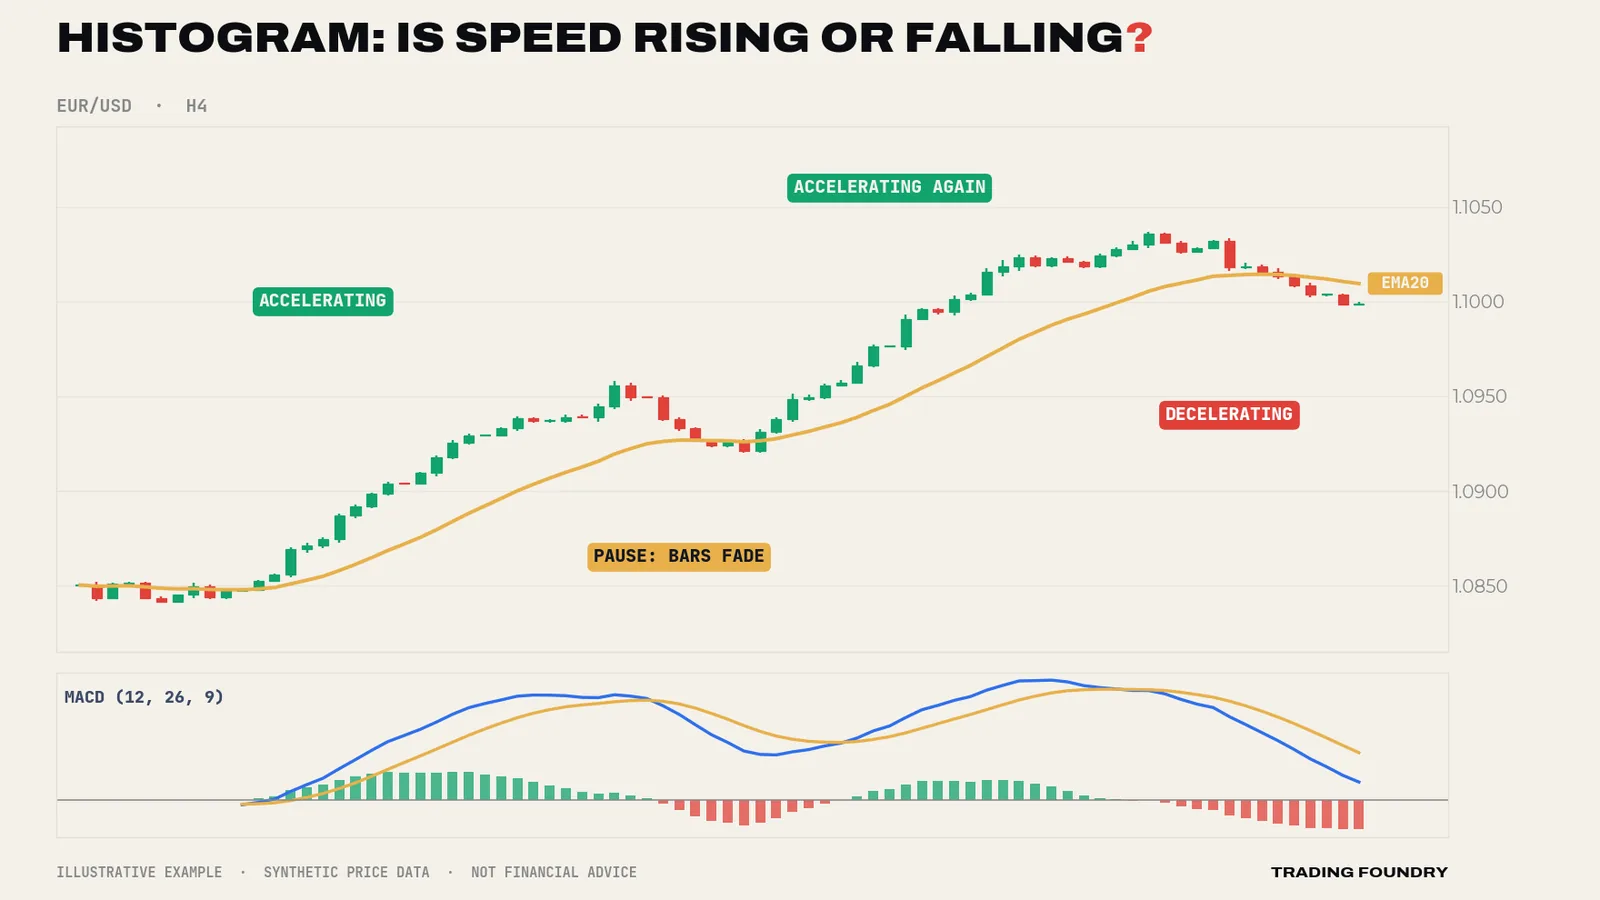
A useful mental picture: you are a passenger in a car. The speedometer is the MACD line. The feeling of being pressed back into your seat is the histogram. You can be travelling at 70 miles an hour (high MACD) with no feeling of acceleration at all (histogram near zero). You can be travelling slowly but feel a strong push (low MACD, growing histogram) as the driver puts their foot down. Neither reading tells you where the car will be in ten minutes.
What MACD cannot tell you
An honest instrument has an honest specification. MACD measures the relationship between two averages of past closing prices. That means there are things it simply cannot see.
It cannot see levels. MACD has no idea that price is sitting on a major support zone, a prior swing high or a round number. It will happily show strong upward momentum straight into resistance. Levels come from the price chart.
It cannot see the future. Every input is a past close. When MACD turns, it is because price has already turned. That is not a flaw to be fixed with clever settings; it is the definition of an average. Lesson 2 measures exactly how much this lag costs.
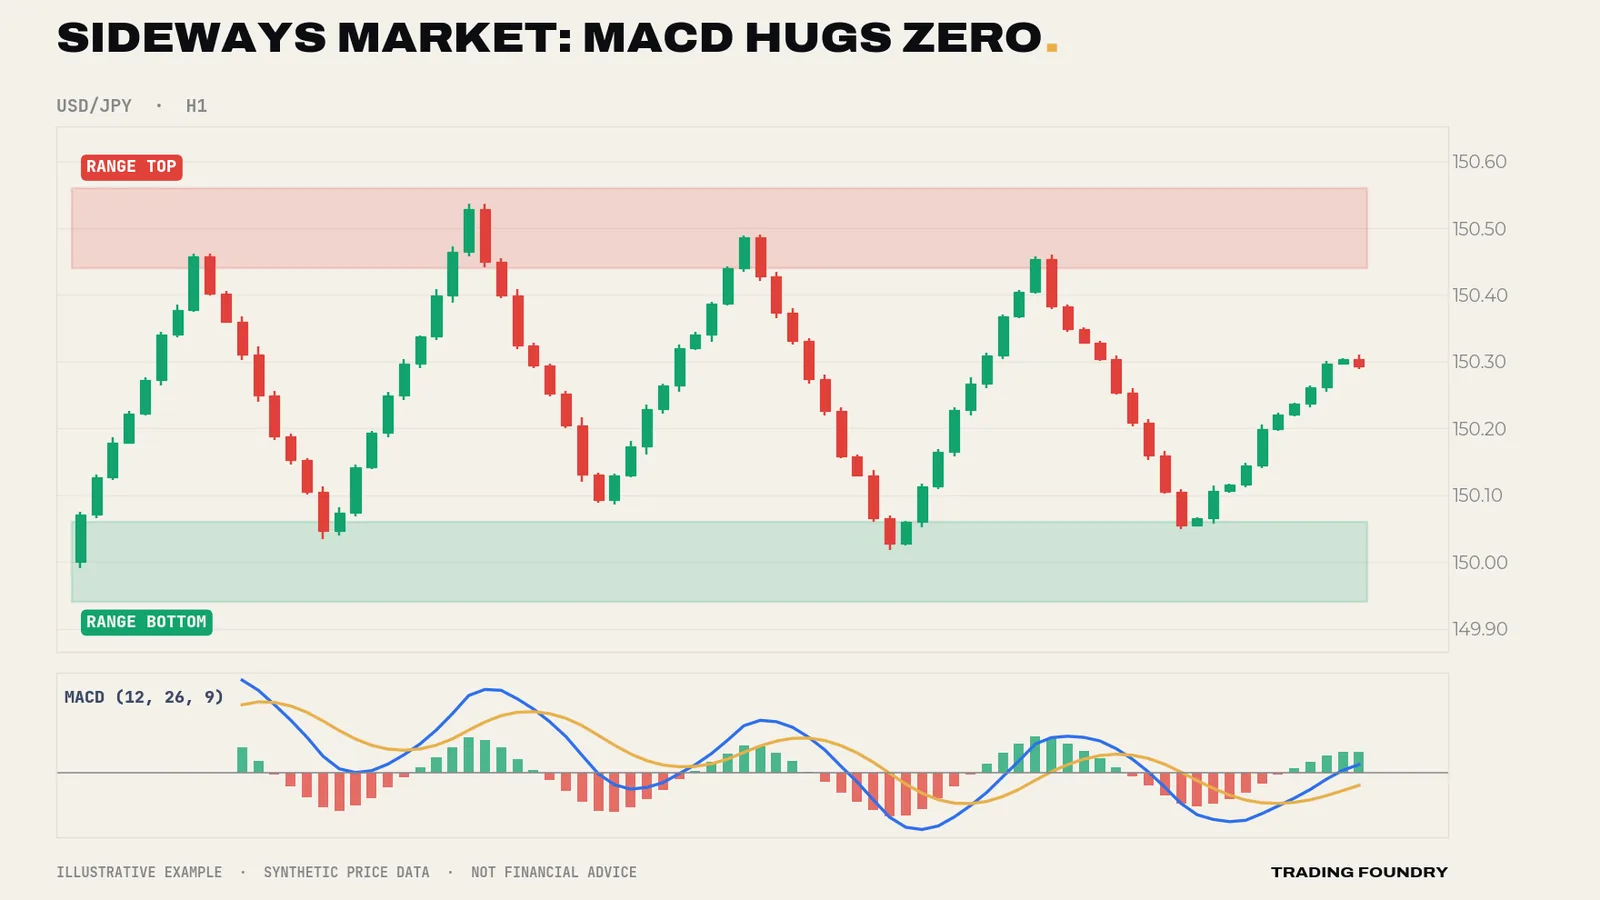
It does not know about ranges. In a sideways market, the two averages wind around each other and the MACD line wanders back and forth across zero, producing a stream of crossovers that mean almost nothing. Lesson 8 is devoted to this.
Its values are not comparable across markets. Because the MACD line is measured in price units, a reading of +20 on EUR/USD hourly and +20 on USD/JPY daily mean completely different things. The numbers on the axis matter far less than the shape: rising or falling, above or below zero, growing or shrinking bars.
Reading a MACD pane in four questions
Before any of the strategies later in this course, train your eye with four questions. Ask them, in this order, every time you look at a MACD pane:
- Is the MACD line above or below zero? This tells you whether the 12 EMA is above or below the 26 EMA — a broad description of which side has been in control recently.
- Is the MACD line rising or falling? This tells you whether the trend's speed is increasing or decreasing.
- Are the histogram bars growing or shrinking? This tells you whether that change in speed is itself gaining or losing force.
- Does the price chart agree? Swing highs and lows, support and resistance, and the slope of price always have the final word.
Work through the four charts in this lesson using those questions. You will find you can describe each one in a sentence: "fast uptrend, now slowing", "trend paused then accelerated", "no trend at all". That sentence is what MACD is for. Everything else in this course builds on it.
Going deeper
The histogram is a rate of change of a rate of change. The MACD line approximates the first derivative of a smoothed price — its slope. The signal line is that slope smoothed again over nine candles, which lags it by roughly four candles. So the histogram (MACD minus signal) is approximately four times the recent change in the MACD line: a smoothed second derivative. This is why the histogram turns first, the MACD line turns second, and the zero line is crossed last. The order is mechanical, not a market pattern, and you should expect it every time.
Why EMAs and not SMAs. An exponential average weights recent closes more heavily, so it responds faster and does not "drop" an old price off the end of the window. With simple averages, a big candle leaving the window can move the indicator even when nothing happens today. EMA-based MACD avoids that artefact, which is one reason the default has survived for decades.
Volatility scaling. Because MACD is in price units, a quiet market produces small readings and a volatile market large ones. Some traders divide MACD by price, or by the average true range, to make readings comparable across markets — the "percentage price oscillator" is the first of those. For the discretionary methods in this course you do not need any of that, because every decision is made relative to the same chart's recent history: is the line higher or lower than before, above or below zero, are the bars growing or shrinking?
Start-up distortion. An EMA needs history to settle. The first few dozen candles of any MACD calculation are unreliable, because the averages were seeded on a single price. Platforms handle this by loading plenty of history; it only matters if you are building the indicator yourself or testing on short data sets.
Summary
- The MACD line is the 12 EMA minus the 26 EMA — the gap between a fast and a slow average.
- Read the line as speed: positive and rising means an uptrend that is speeding up; positive and falling means an uptrend that is slowing.
- The signal line is a 9-period average of the MACD line; the histogram is the difference, and reads as acceleration.
- "Signal line crossover" and "histogram changes colour" are the same event.
- MACD cannot see levels, cannot see the future, and produces meaningless crossovers in ranges. Price structure has the final word.
Quick quiz.
Education only, not financial advice. Charts are illustrative training examples using synthetic price data, not real market history or results.