 TRADING FOUNDRY
Why Breakouts Fail So Often.
Explain what actually happens in the order book when a level breaks, and use it to predict which breakouts are likely to fail before you risk a penny.
Every trader has bought a breakout at the exact high of the day. The level snaps, a big green candle surges through, you buy — and within three candles price is back inside the range, your stop is gone, and the market is running hard the other way. It feels personal. It is not. It is mechanical, and once you understand the mechanism, you stop being its fuel.
This course is about trading breakouts properly: which ones to take, which ones to leave, and why the most reliable entry usually comes after the break, when price returns to test the level it just broke. But we start with failure, because failure is the normal state of affairs. If you take one idea from this first lesson, take this: a breakout is not a signal. It is a question the market asks, and most of the time the answer is no.
Markets breathe in, then out
Markets do not trend all the time. Most of the time price drifts sideways in a band while buyers and sellers agree, roughly, on what something is worth. Candles are small. Swings are short. Then, occasionally, the agreement breaks down — news lands, positions get too crowded, a big order arrives — and price moves fast and far until it finds a new area of agreement.
That alternation — contraction, then expansion — is the reason breakout trading exists. Contraction stores energy: positions build up on both sides of a range, and so do the stop-losses protecting them. Expansion releases it. The breakout trader's job is to be positioned for the release without being fooled by the many false starts that precede it.
Where the orders actually sit
To understand why breaks fail, you need a picture of what is resting around an obvious range. There are three clusters of orders, and none of them are secret.
Stop-losses. Traders who sold the range high have protective buy stops just above it. Traders who bought the range low have sell stops just beneath it.
Breakout entries. Traders waiting for the level to go have buy-stop orders above resistance and sell-stop orders below support.
Range traders. People who intend to keep selling the top and buying the bottom until proven wrong, plus those taking profit from earlier moves.
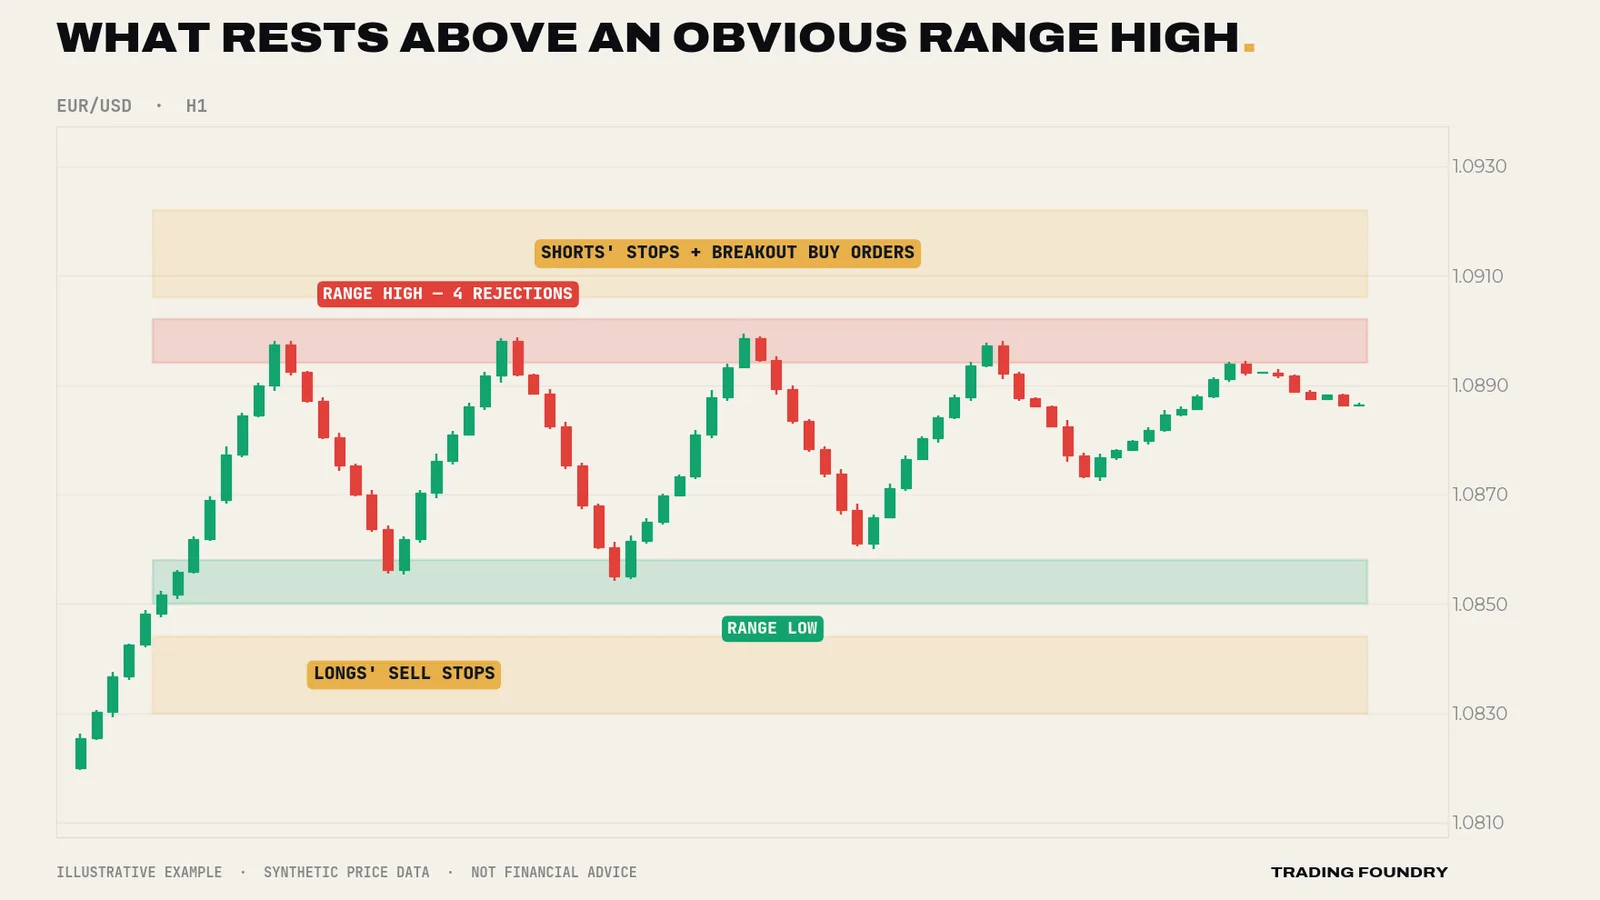
When price pushes through the range high, the first two clusters fire together. Shorts are forced to buy back; breakout traders buy to enter. That is a burst of one-way demand hitting a patch of the order book where sellers have been filled or have stepped away. Price jumps. This is why genuine breakouts often move quickly: they are partly powered by traders who are wrong and have to exit, which is the most motivated buying in the market.
Now notice the problem. That burst is finite. Once the trapped shorts have covered and the eager breakout buyers are filled, the move needs a second wave — fresh buyers who want to own the market at higher prices — or it stalls. And if a large seller was waiting for exactly this burst of buying to sell into, the burst is the end of the move, not the start.
The trap, step by step
Large participants cannot fill big orders in a quiet market; they need someone on the other side. The pool of buy orders above an obvious range high is the most convenient place on the chart to sell size, because thousands of buy orders trigger there at once. So price spikes above the level, the buying is absorbed, and the market falls back through. Everyone who bought the break is now trapped above, and their stops — back inside the range — become fuel for the move down.
No conspiracy is required. Nobody needs to "hunt" anybody. Liquidity simply clusters where the crowd puts its orders, and large orders go where the liquidity is.
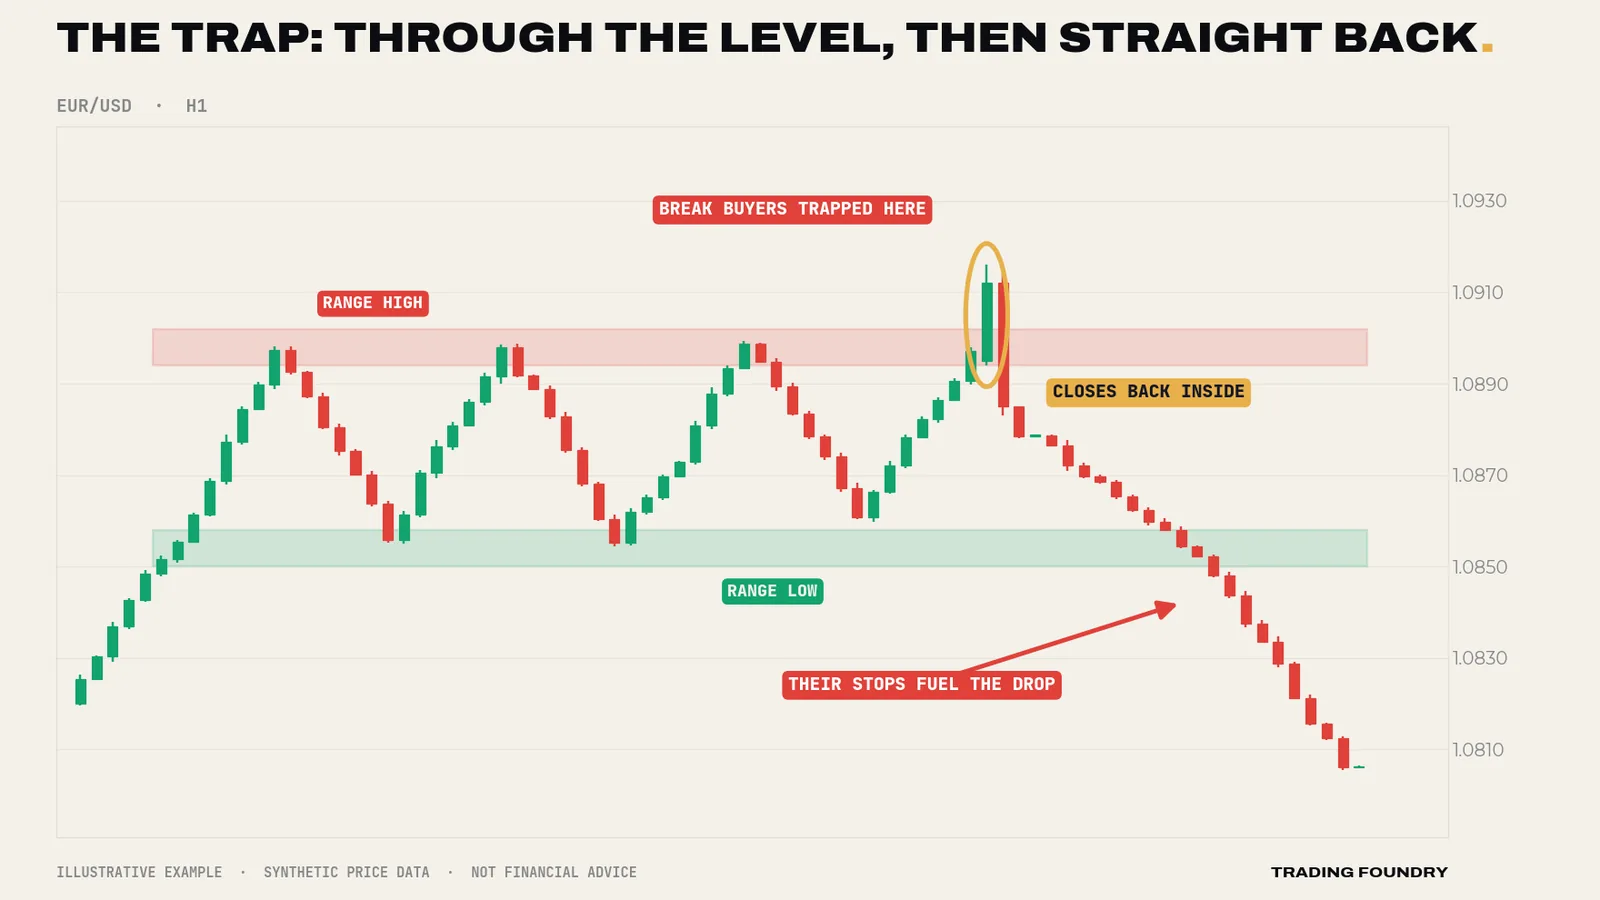
Look at the sequence carefully, because you will see it hundreds of times. The break looked convincing; it even closed above the level. The next candle handed it all back. Within a dozen bars price had travelled the full height of the range and broken the other side. Failed breakouts very often produce fast journeys to the opposite boundary, because the trapped traders have to get out and their exits all point the same way.
What a break the market accepts looks like
Compare that with a break the market actually wants. The difference is rarely in the breakout candle itself. It is in what happens over the next few candles.
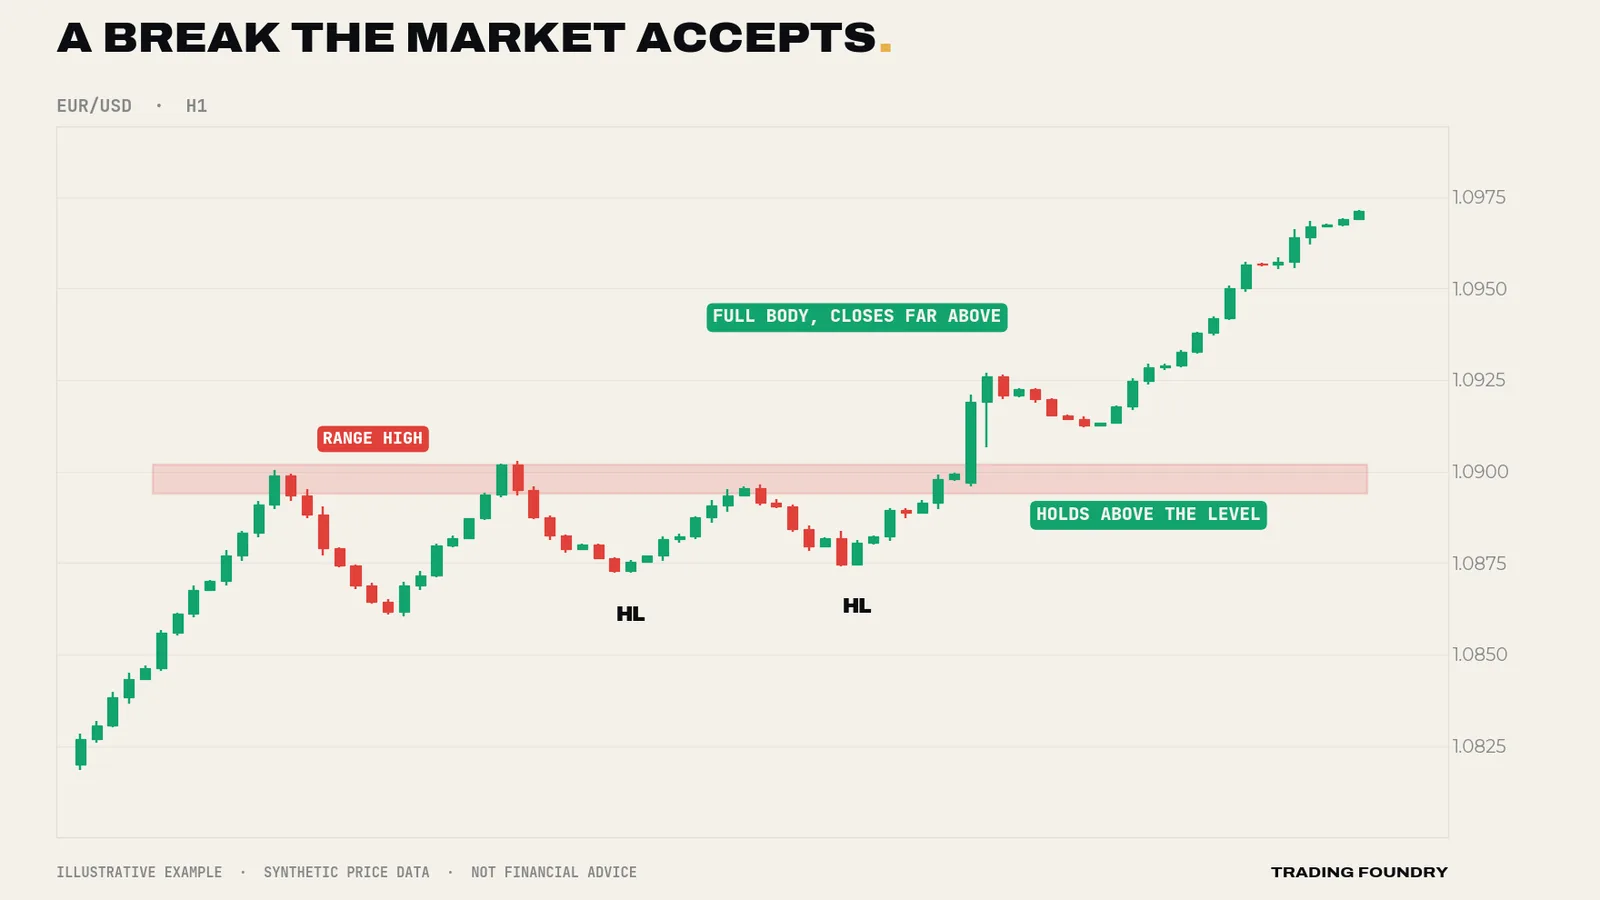
Three things separate this from the trap. First, the approach: lows were rising into the ceiling, so buyers were already turning up earlier each time. Second, the close: a full-bodied candle that finished well beyond the zone, not a wick poking through it. Third, acceptance: price paused but lived comfortably above the old resistance instead of slicing back through it. You will learn to grade all three in Module 2.
Breaks fail for reasons you can see in advance
Most failed breakouts are not random. They carry fingerprints that are visible before the trade. The common ones:
- No compression. The "range" was sloppy and overlapping, with spikes out of both sides. Nothing was coiled, so nothing was stored.
- A bigger wall just beyond. The level broke straight into a higher-timeframe level a few dozen pips away. There was no room to run.
- Against the higher-timeframe trend. A break against the dominant flow needs much stronger evidence, because the larger players are positioned the other way.
- The wrong hour. Thin, late-session or holiday conditions. A breakout needs participation. No participants, no breakout — just a spike.
- A wick, not a close. Price traded beyond the level but the candle closed back inside. That is a rejection dressed as a breakout.
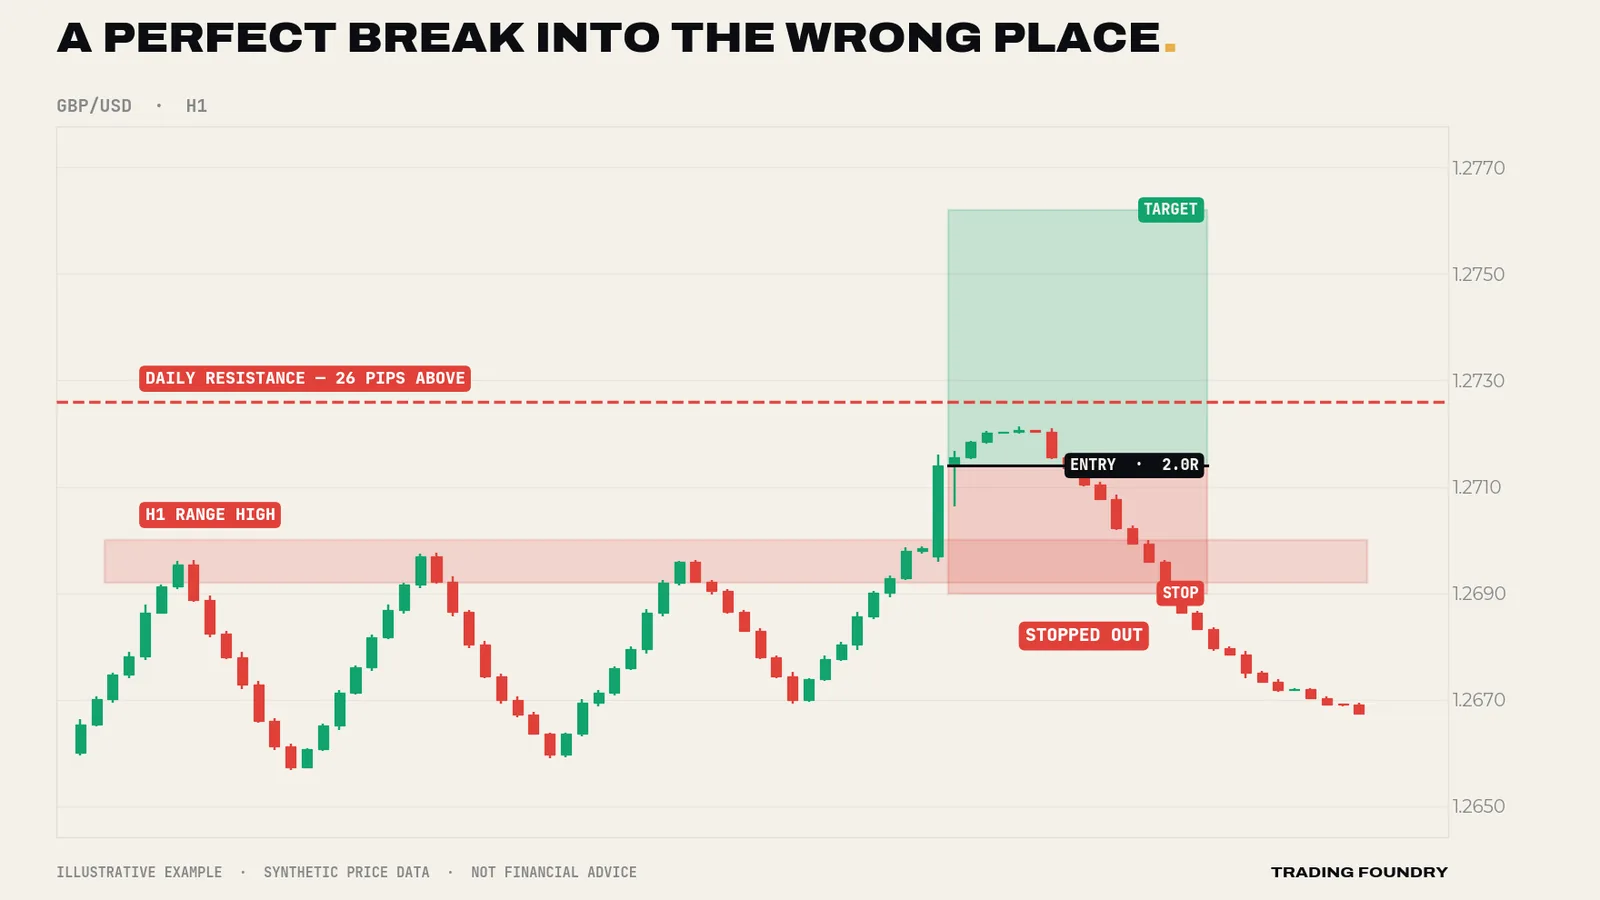
This last chart is the most painful kind of failure, because the break itself was textbook. Strong candle, clean close, obvious level. The trader did everything right at the level and nothing right around it. A daily resistance level sat just 26 pips overhead; the target required price to travel through it. The break ran straight into the wall and died.
Two ways to lose with breakouts
Breakout traders lose money in two distinct ways, and the second is sneakier than the first.
The first is obvious: chasing traps. You see a surging candle, fear missing out, and buy at the worst possible price — the exact place the pool of buy orders is being sold into. Then you hold a losing position on the wrong side of a failed level.
The second is the whipsaw of conviction. After being trapped three times, you refuse the next break — and that one is genuine and runs for two days without you. Burned out of money, then burned out of confidence. Most breakout traders cycle between these two states, letting the last trade decide how they treat the next one.
The way out is not courage. It is a written process: which levels, which conditions, which candle, which entry and which invalidation, decided before the session starts. Then the surging candle is just data against a checklist rather than a starting gun. That process is what this course builds, piece by piece.
Going deeper
For experienced traders, it is worth being precise about what "fail" means, because your testing depends on it. Three definitions are common, and they produce very different numbers:
- Close-back-inside failure — the break is dead the moment a candle on your timeframe closes back inside the range. Strict, fast, and the definition this course uses for exits.
- Opposite-side failure — the break is only counted as failed if price reaches the far side of the range. More forgiving, and it inflates apparent success.
- R-based failure — the trade hits a fixed stop before a fixed target. This is the only definition that tells you about expectancy, because it includes your actual entry and exit rules.
Public estimates of breakout failure rates vary enormously because definitions vary, and because failure depends heavily on market, timeframe and session. We will not quote a number. Measure your own, on your own definition, on at least a hundred historical examples, and track trend-aligned and counter-trend breaks separately — they behave differently.
There is also a structural reason breakouts appear to fail more than they succeed: the denominator. Price touches and briefly exceeds levels constantly, and every one of those touches looks like a potential breakout in real time. Only a minority become sustained expansions. This is not a flaw in the strategy; it is the base rate the strategy has to filter. The edge, if there is one, comes from discarding most breaks and paying a good price for the few that pass.
Finally, an expectancy point, with clearly hypothetical numbers. Suppose a filtered breakout approach wins only 40% of the time but its winners average 2R and its losers 1R. Its expectancy is (0.4 × 2) − (0.6 × 1) = +0.2R per trade before costs. A strategy can be right less than half the time and still have a positive expectation — but only if its losses are kept small and cut quickly, which is exactly what breakout traders find hardest when a trap closes around them.
- A breakout is a question, not a signal. Never enter on the break alone without your other conditions.
- Only a candle close beyond the level counts as a break. A wick beyond the level is a rejection.
- Check the level map beyond the break before entry: no room to run, no trade.
- A close back inside the range ends the breakout idea immediately. Exit without negotiation.
Summary
- Markets alternate between contraction and expansion. Breakouts are the moment stored energy is released — or appears to be.
- Above an obvious range high sit shorts' stops and breakout buy orders; that pool of buying is what powers breaks and what larger sellers sell into.
- Failed breaks often run quickly to the other side of the range, because the trapped breakout buyers must exit.
- Genuine breaks are usually built (compression, rising lows), closed decisively, and accepted on the far side.
- Many failures are predictable: sloppy ranges, a bigger level just beyond, counter-trend breaks, dead sessions and wick-only breaks.
Quick quiz.
Education only, not financial advice. Charts are illustrative training examples using synthetic price data, not real market history or results.